Fort Science: Ground Shapes Under Roman Forts
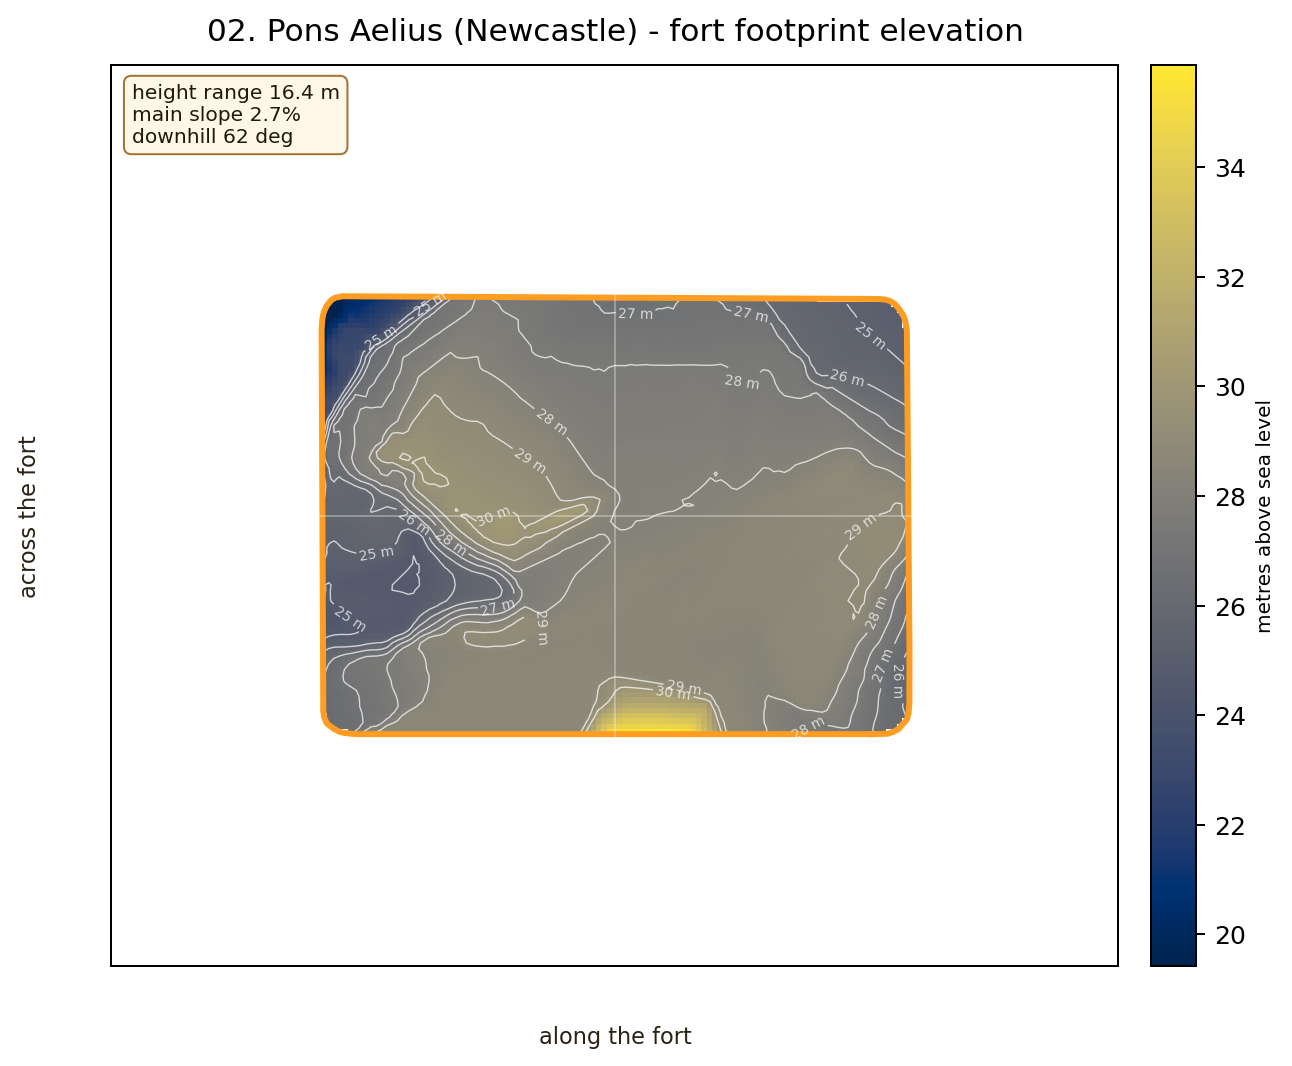
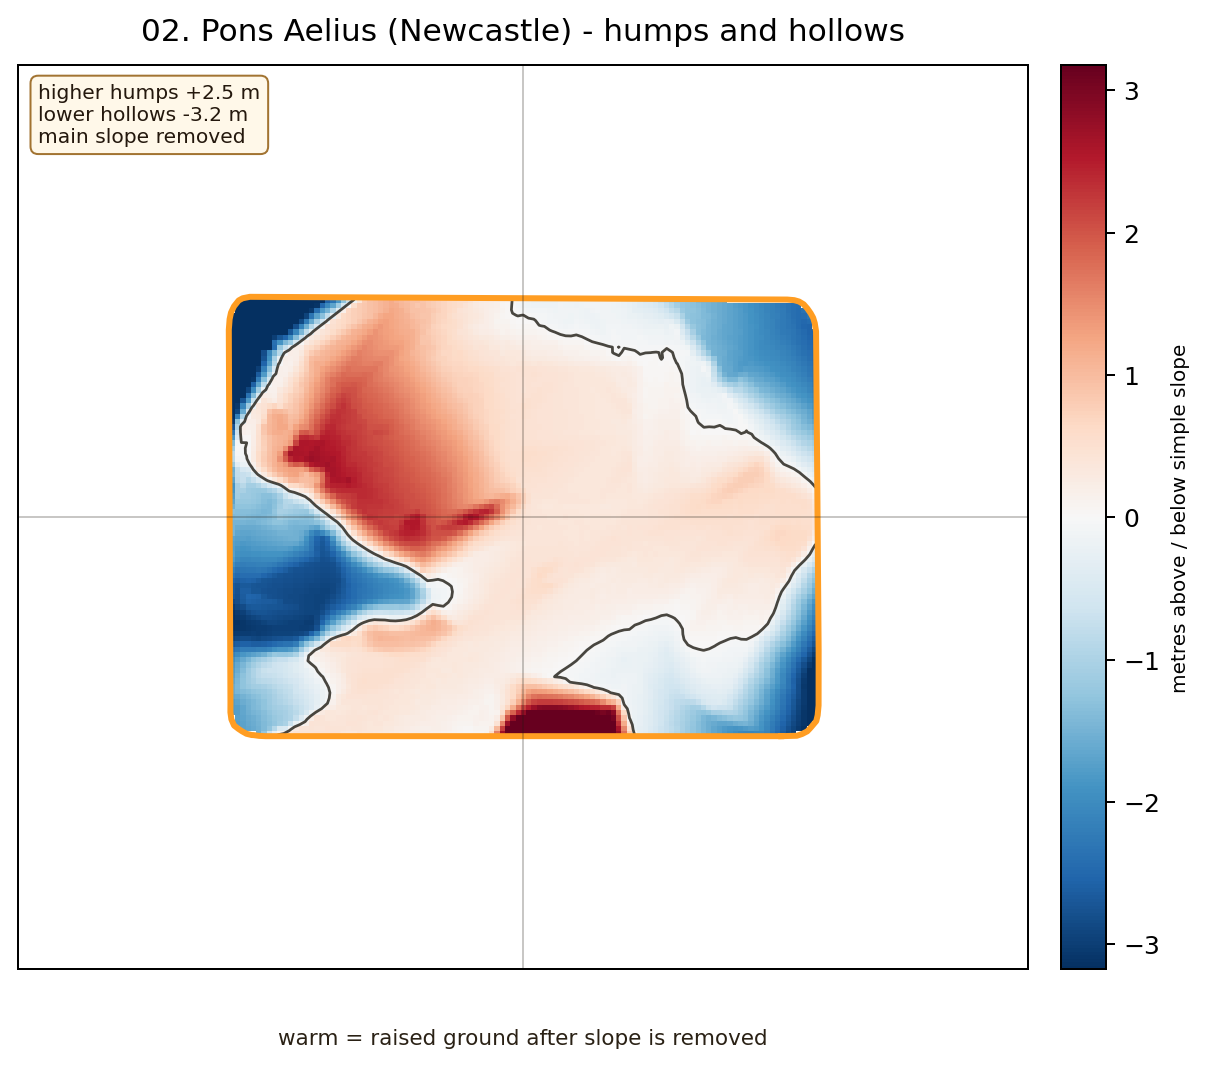
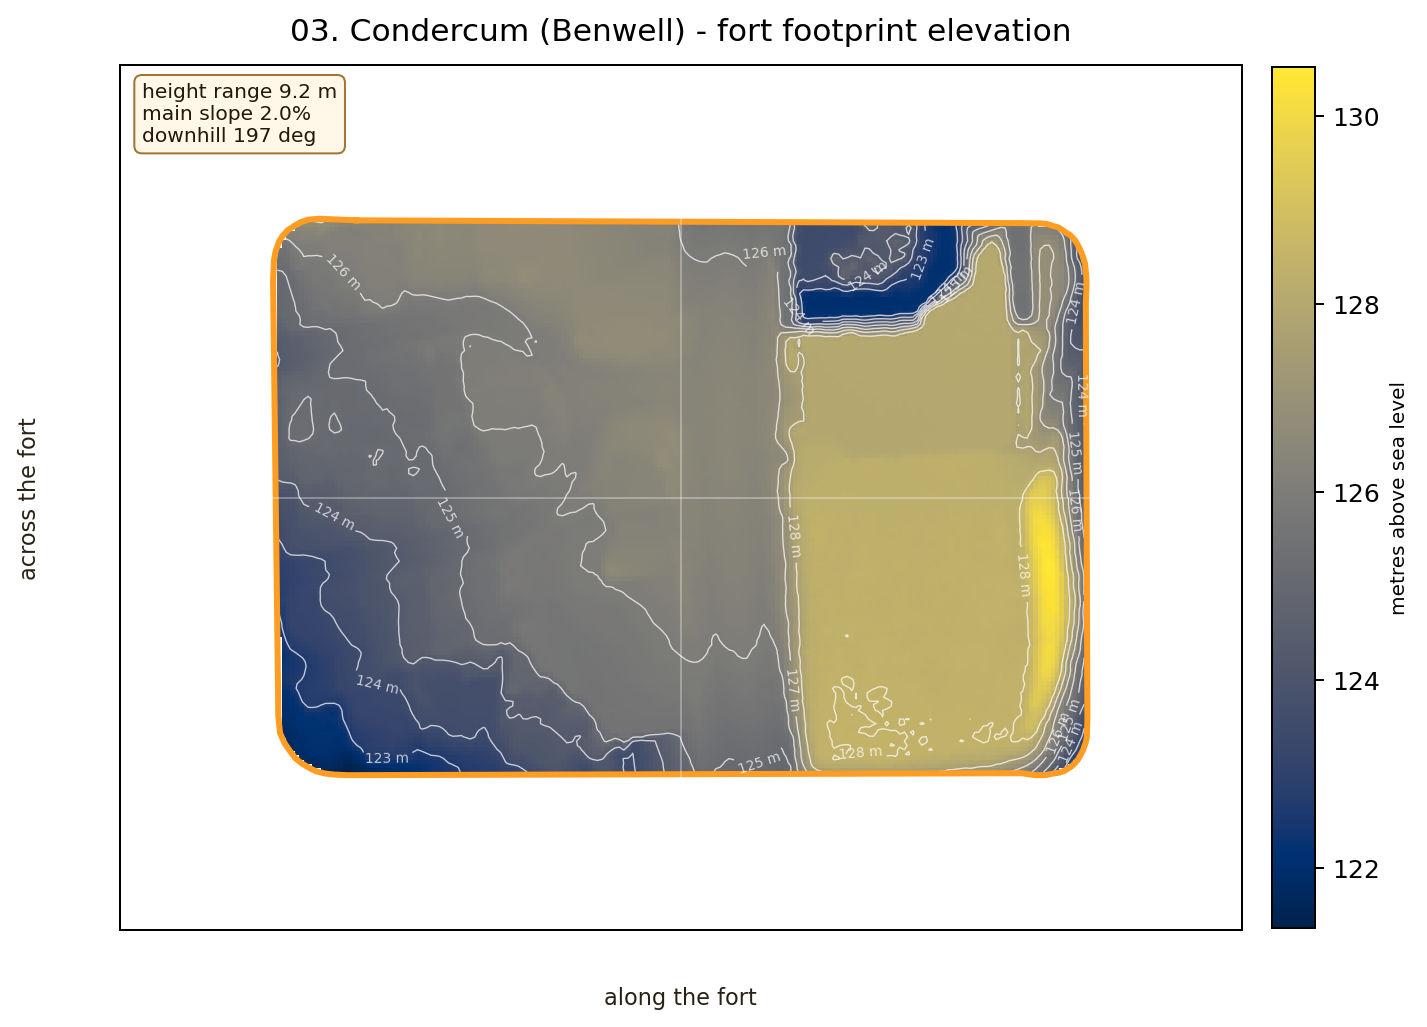
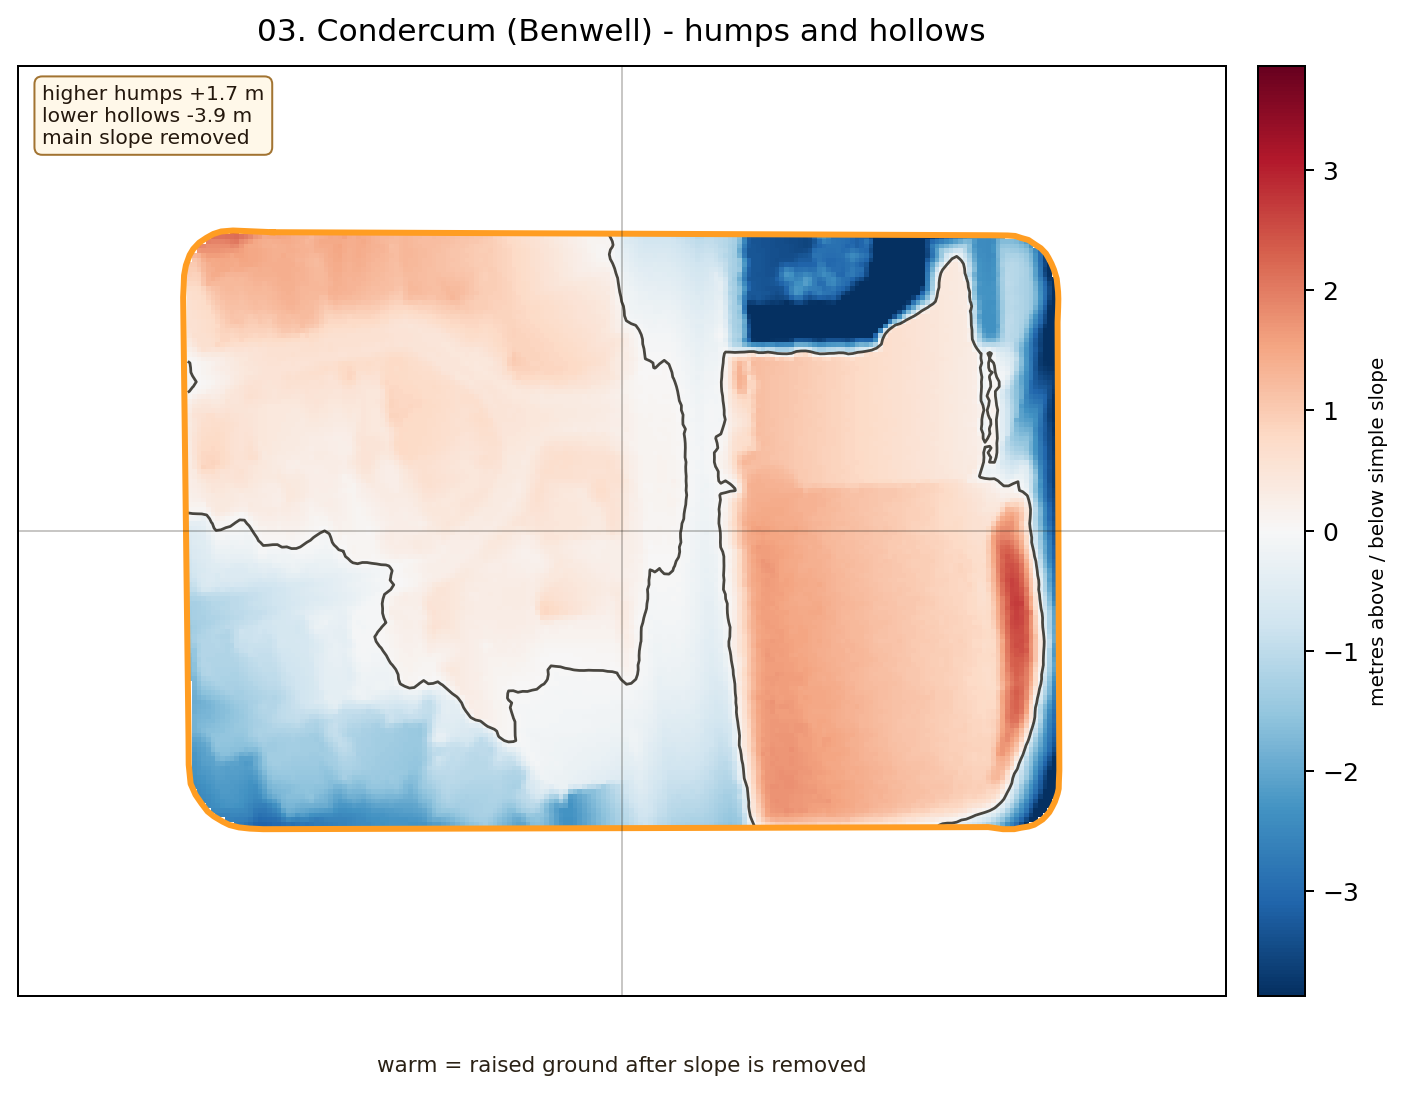
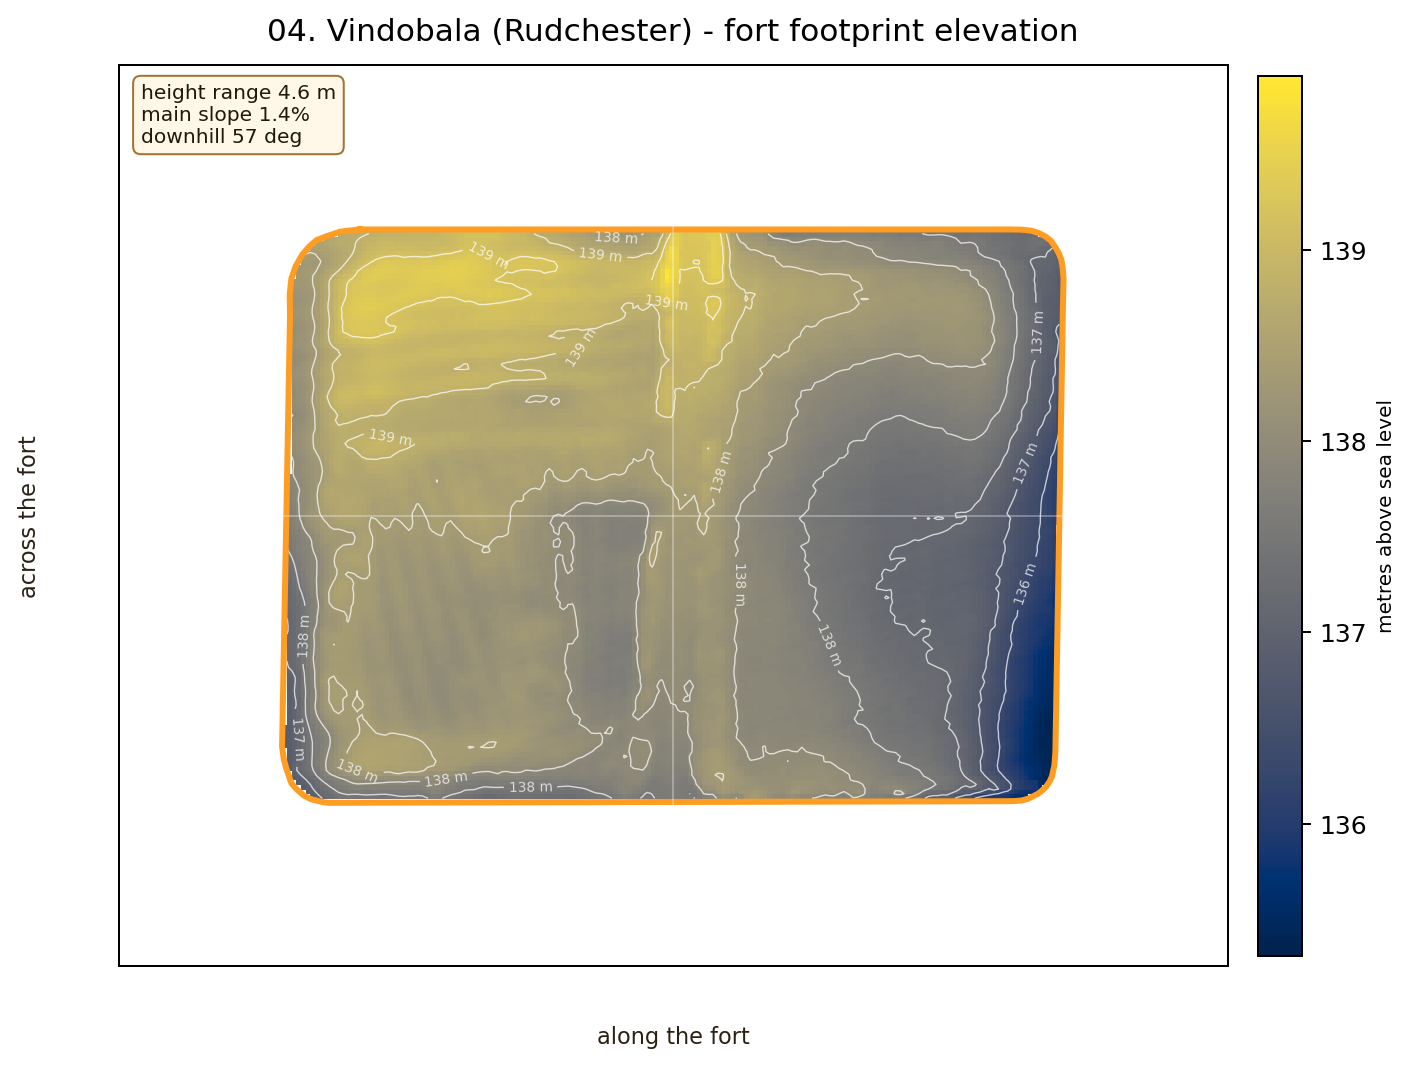
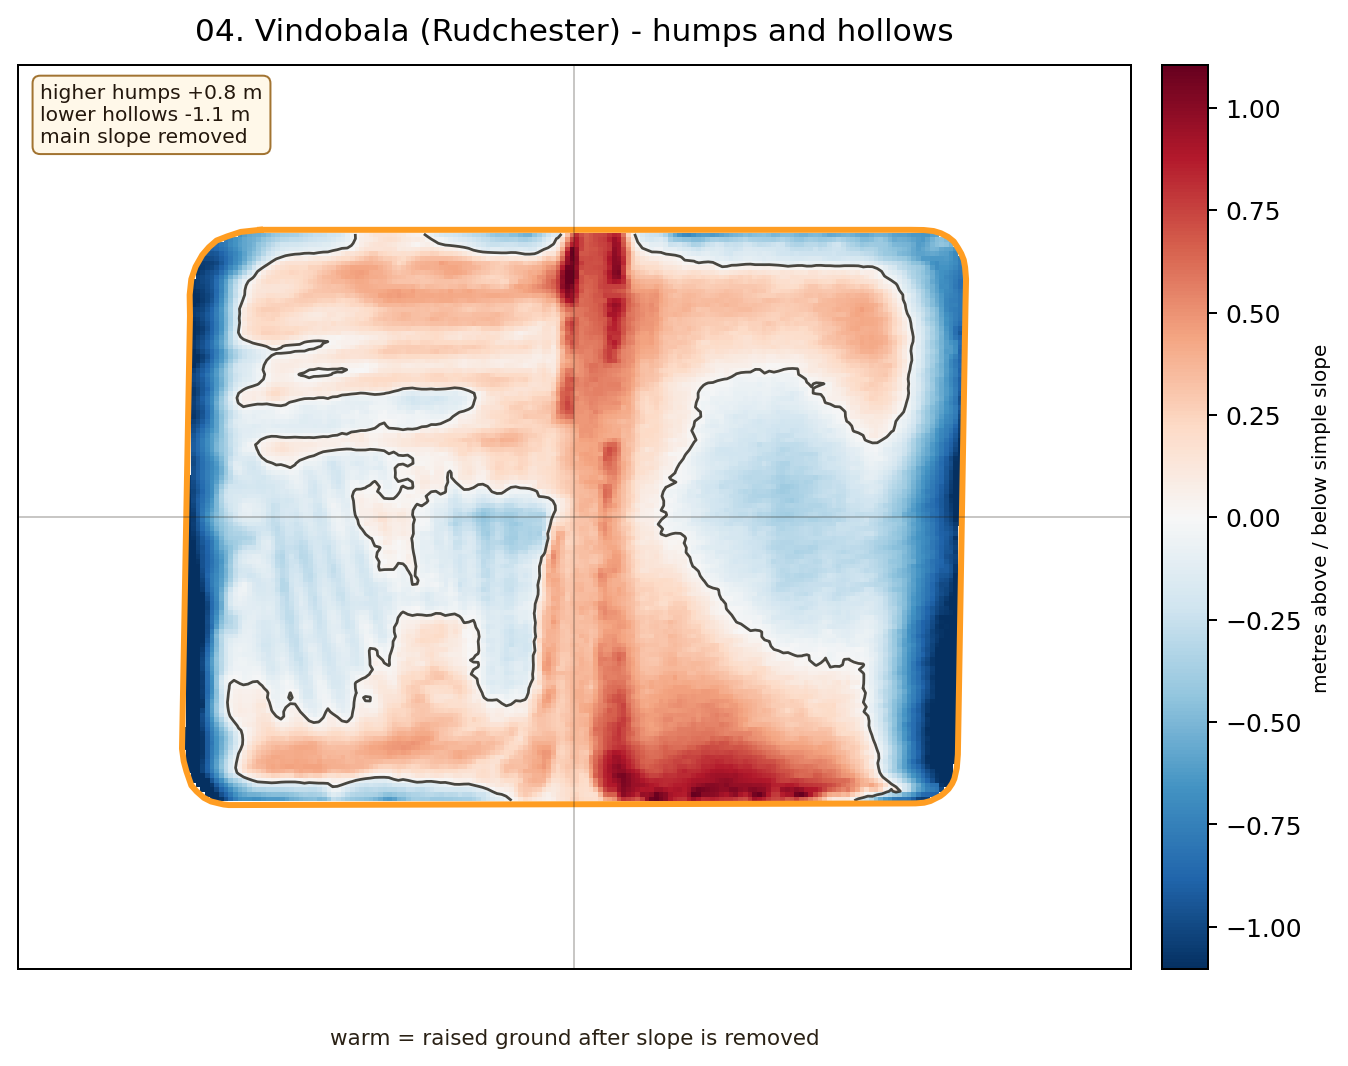
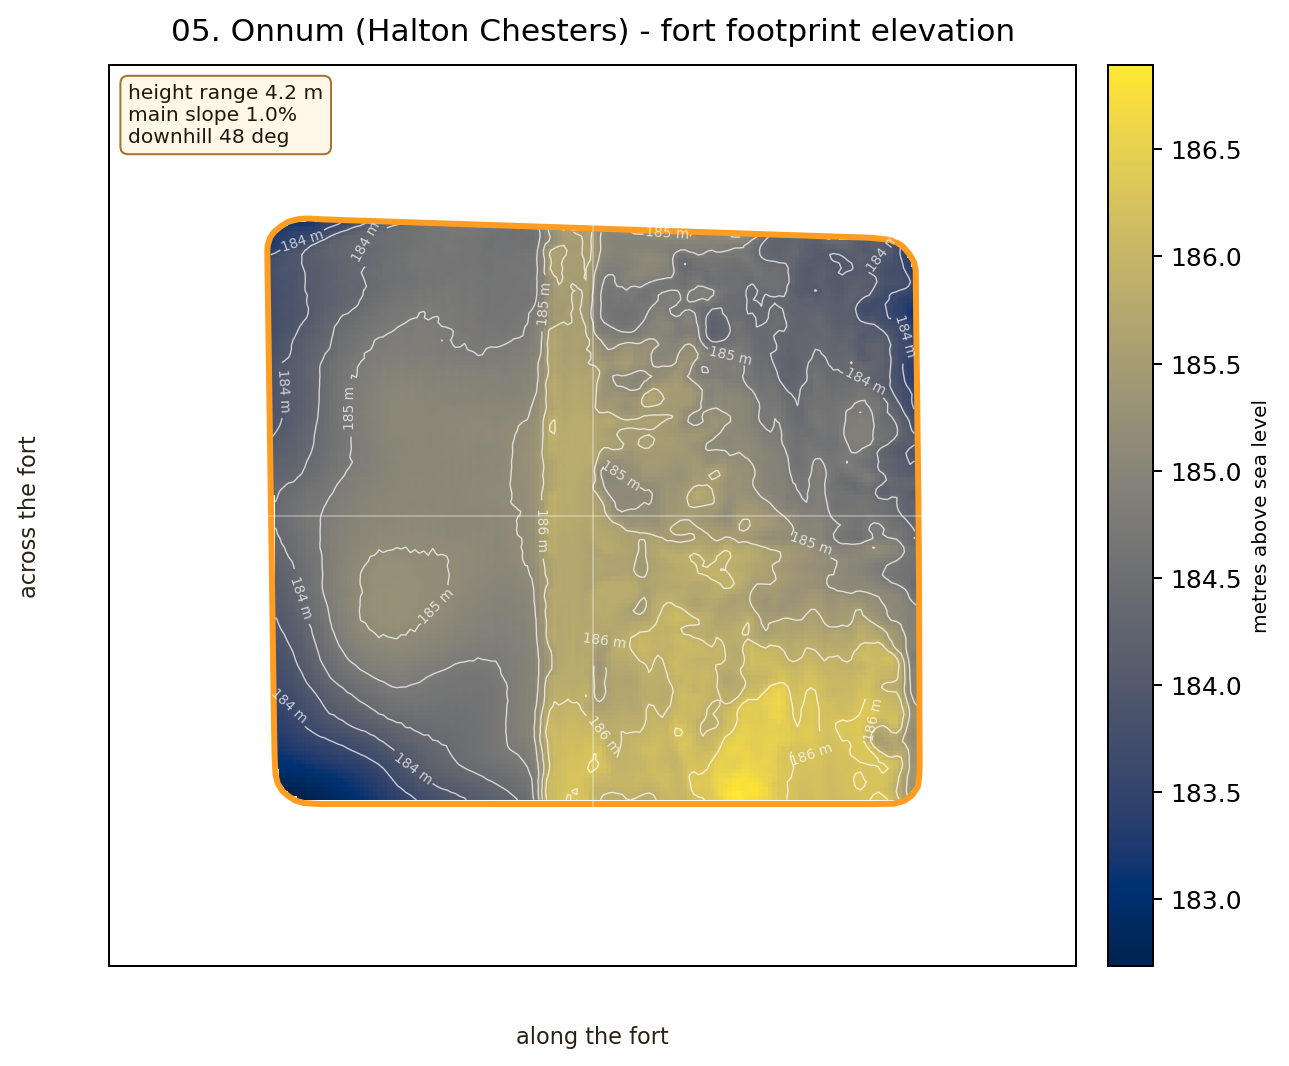
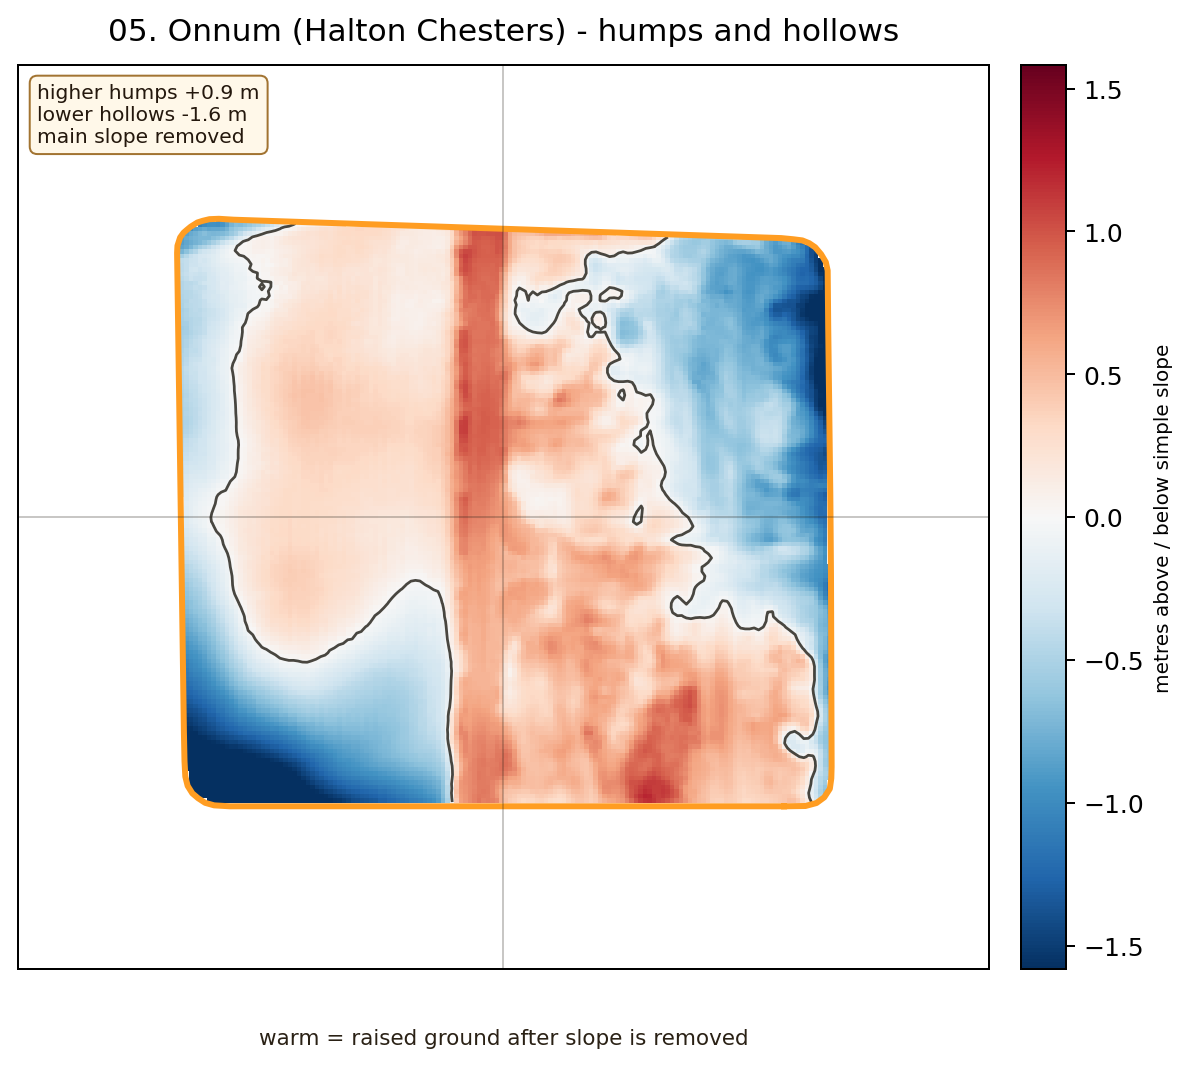
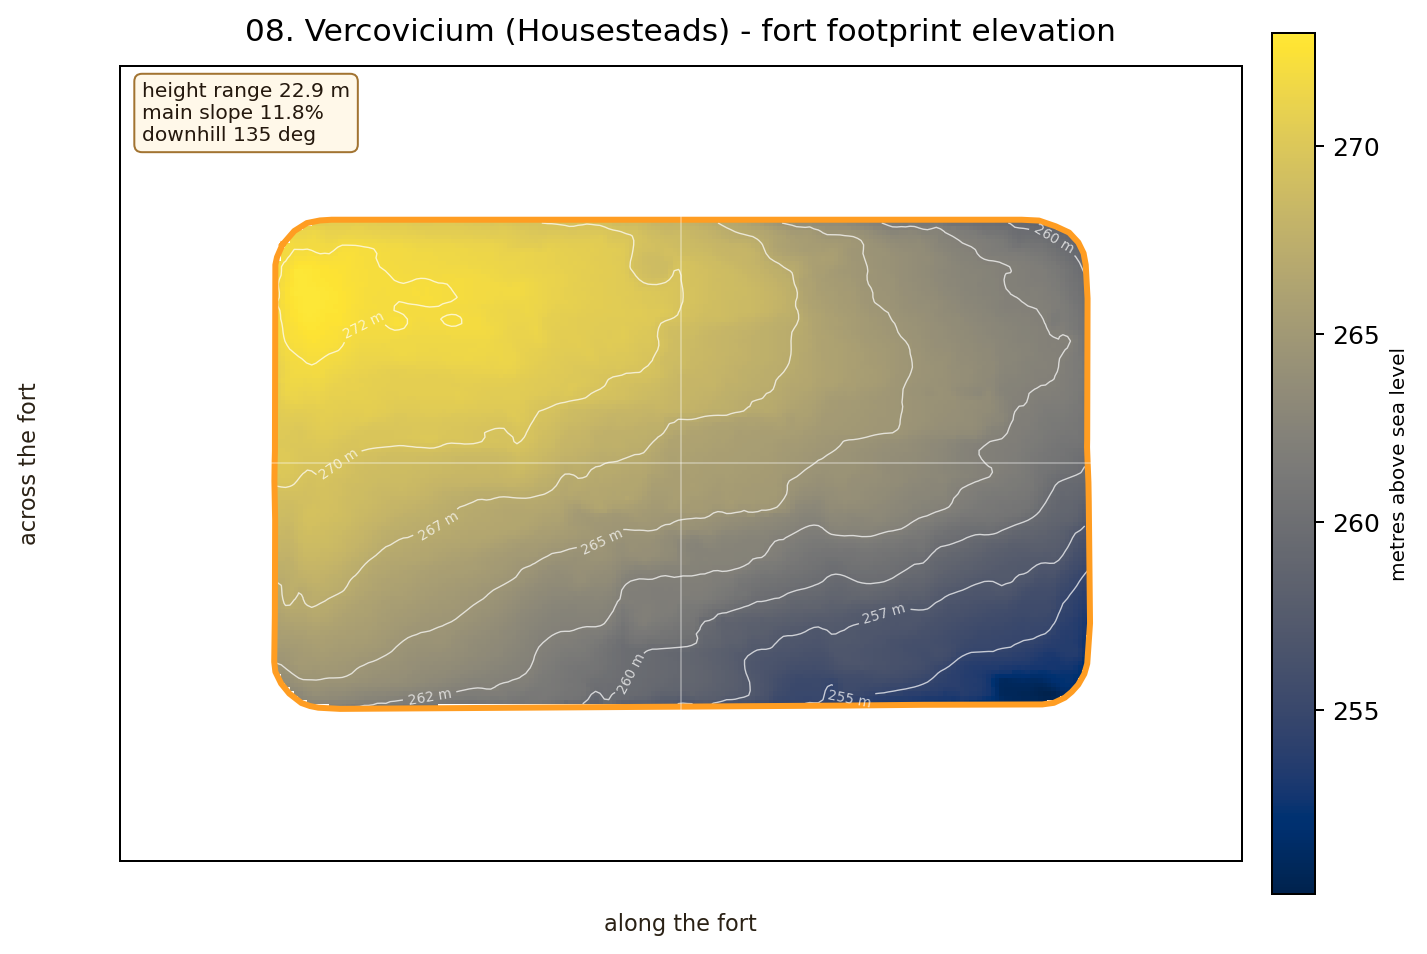
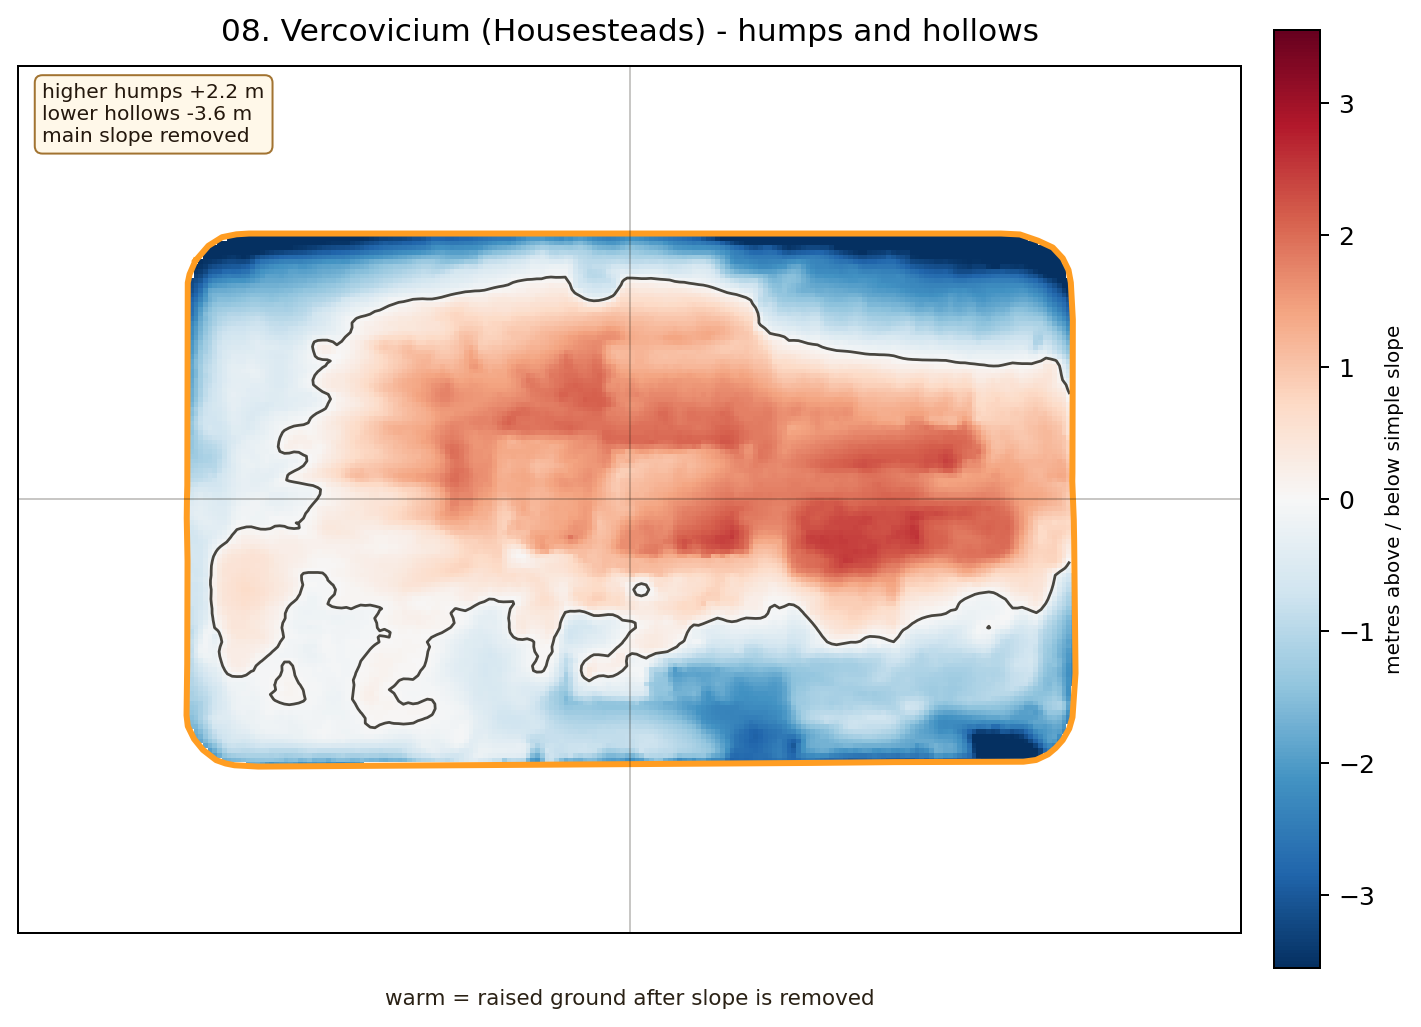
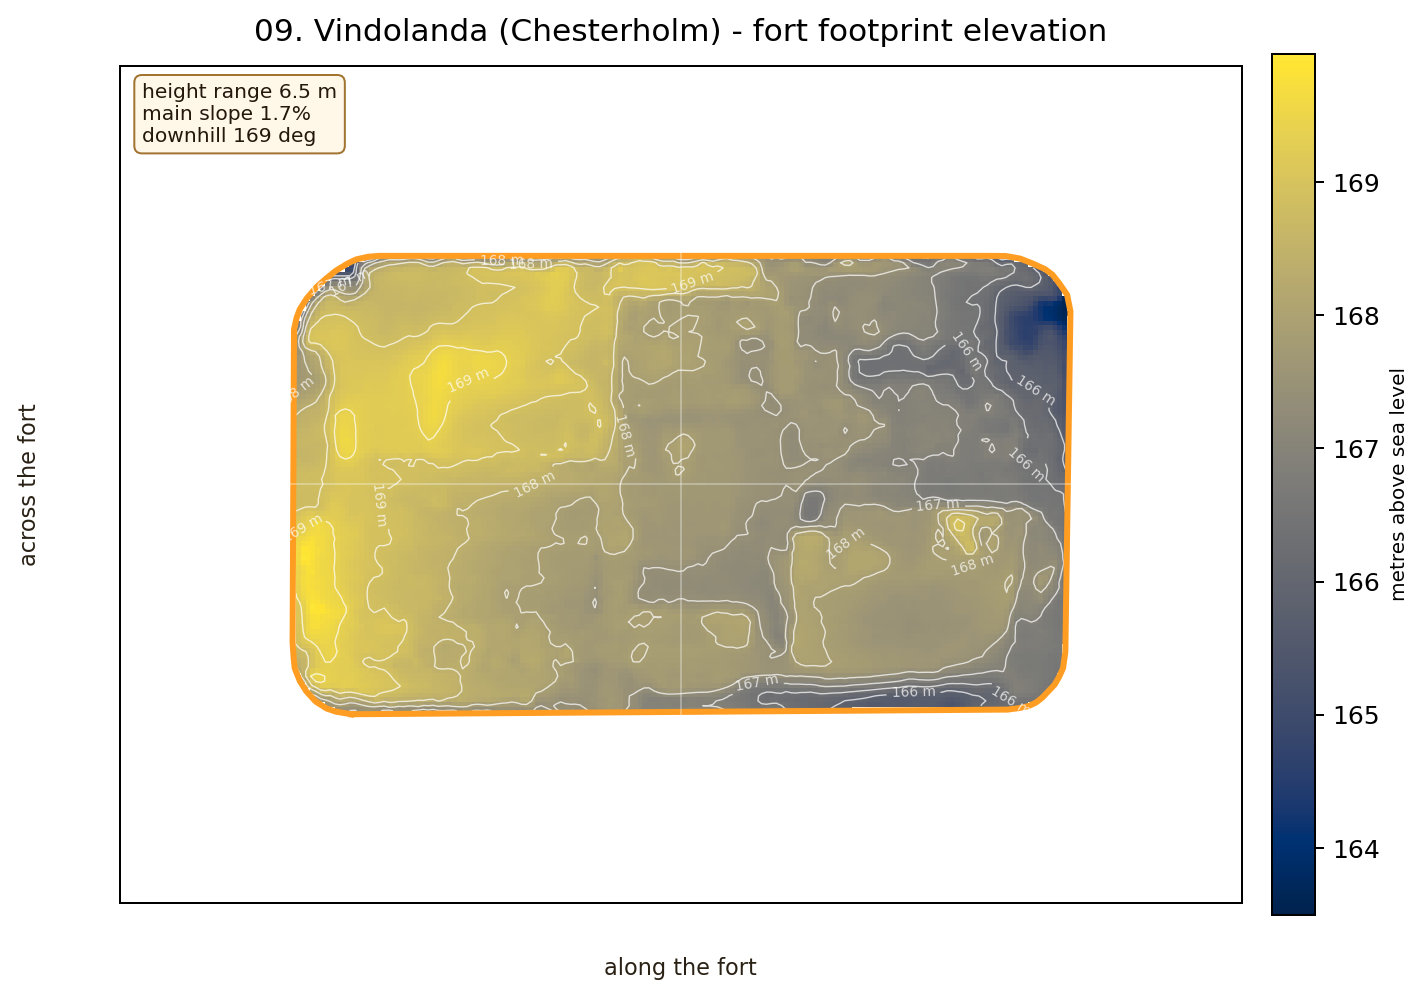
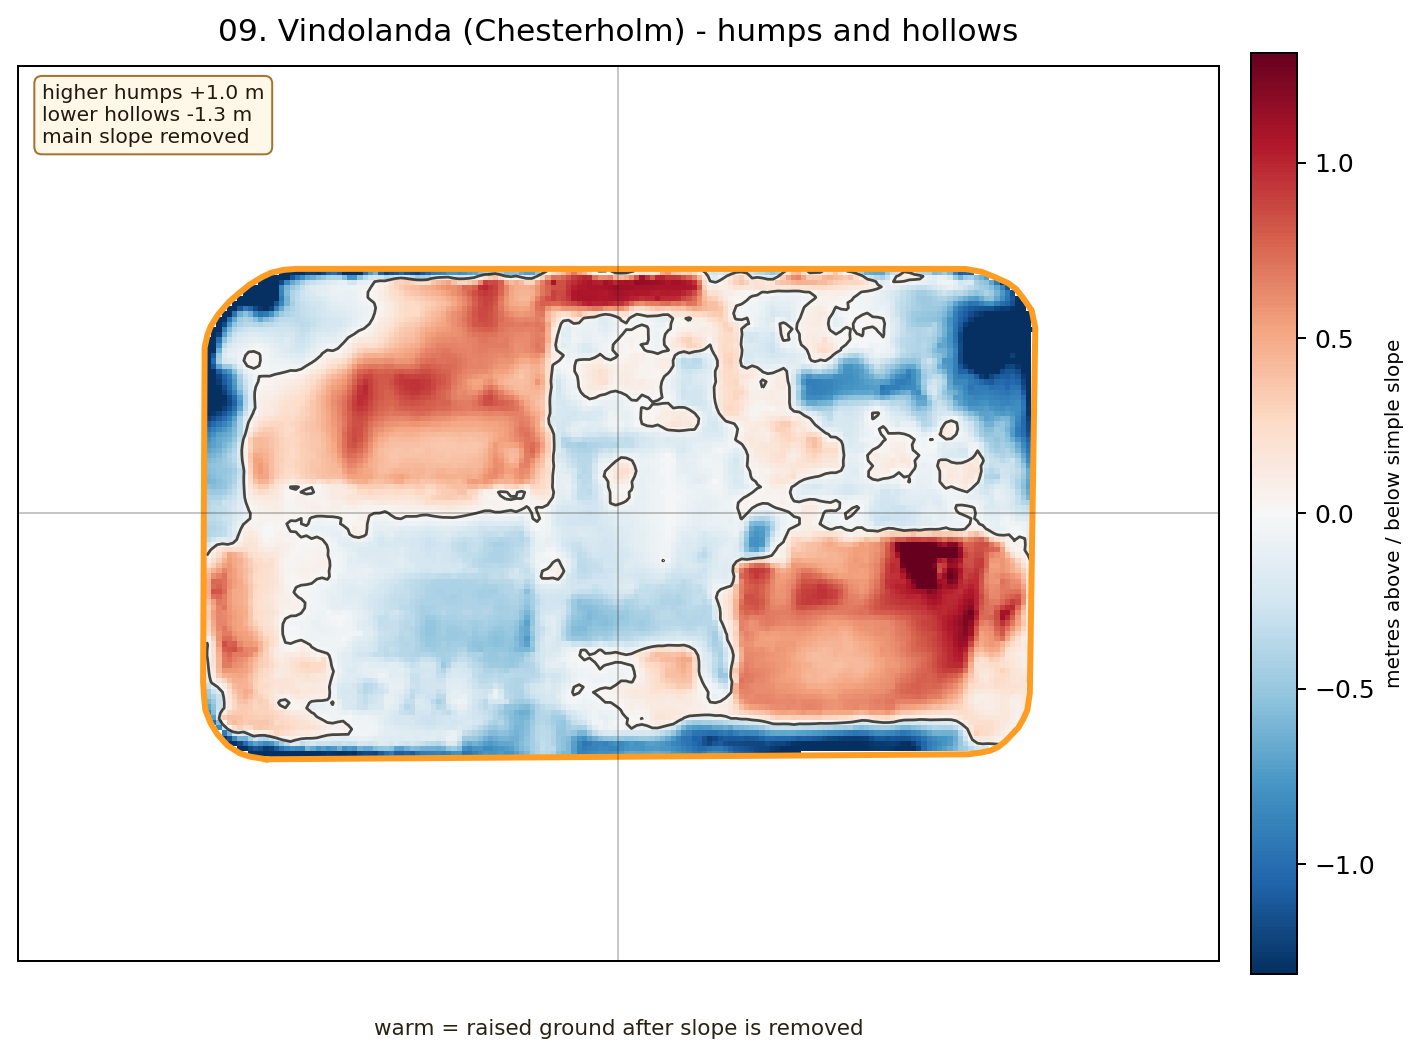
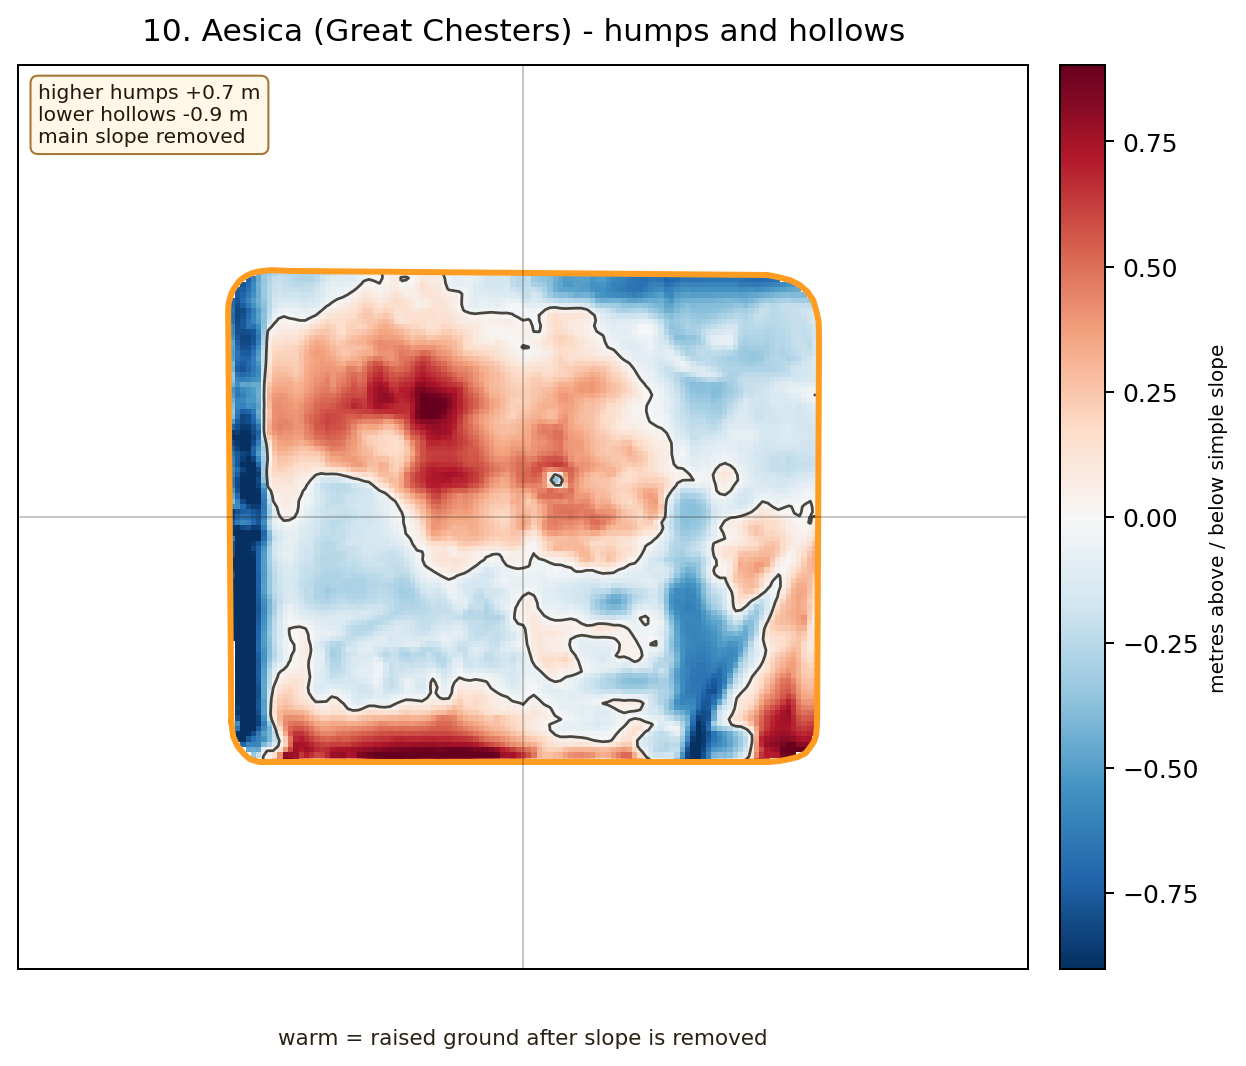
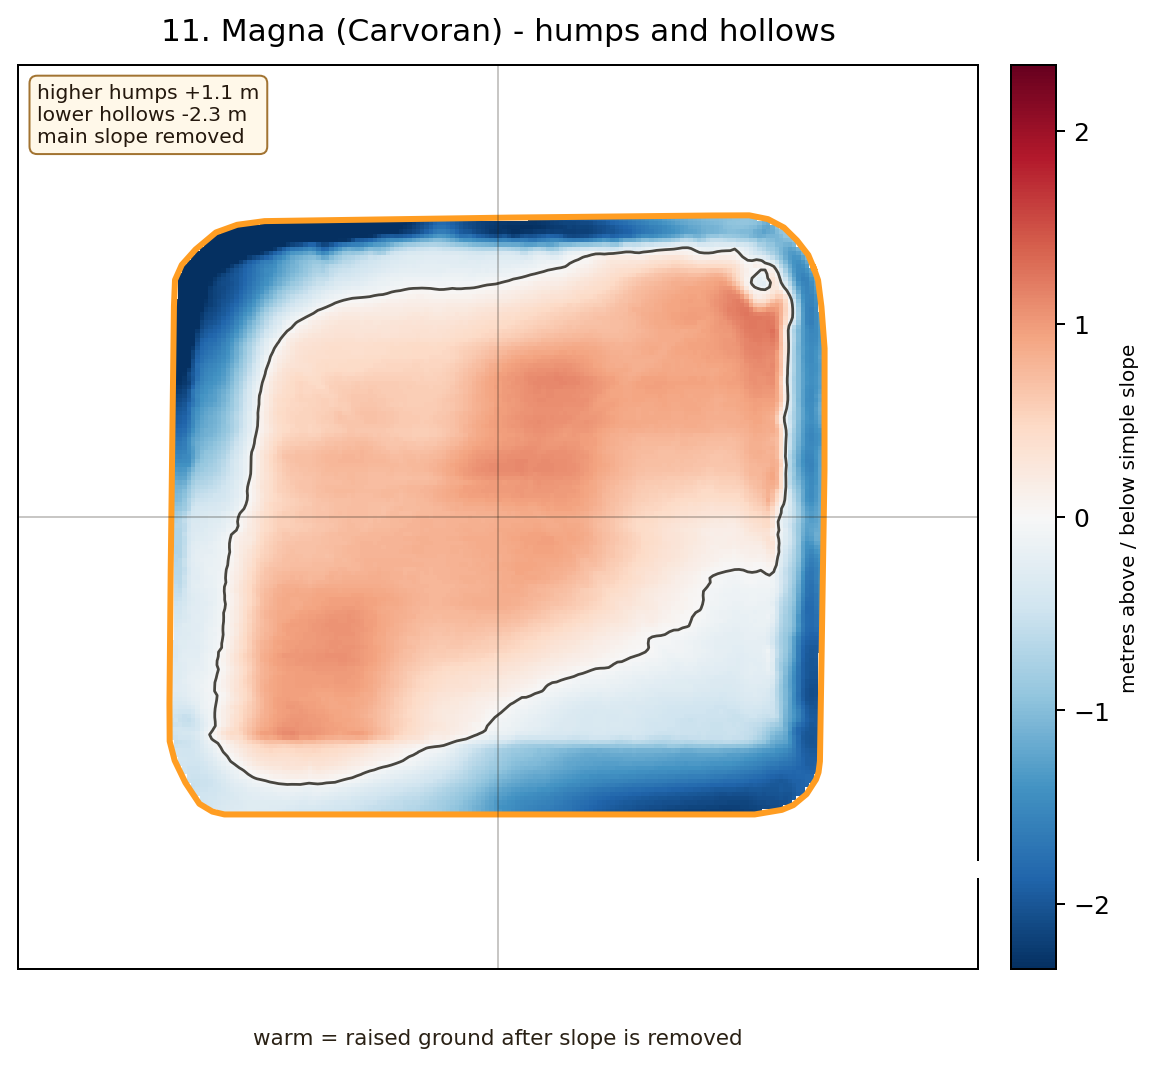
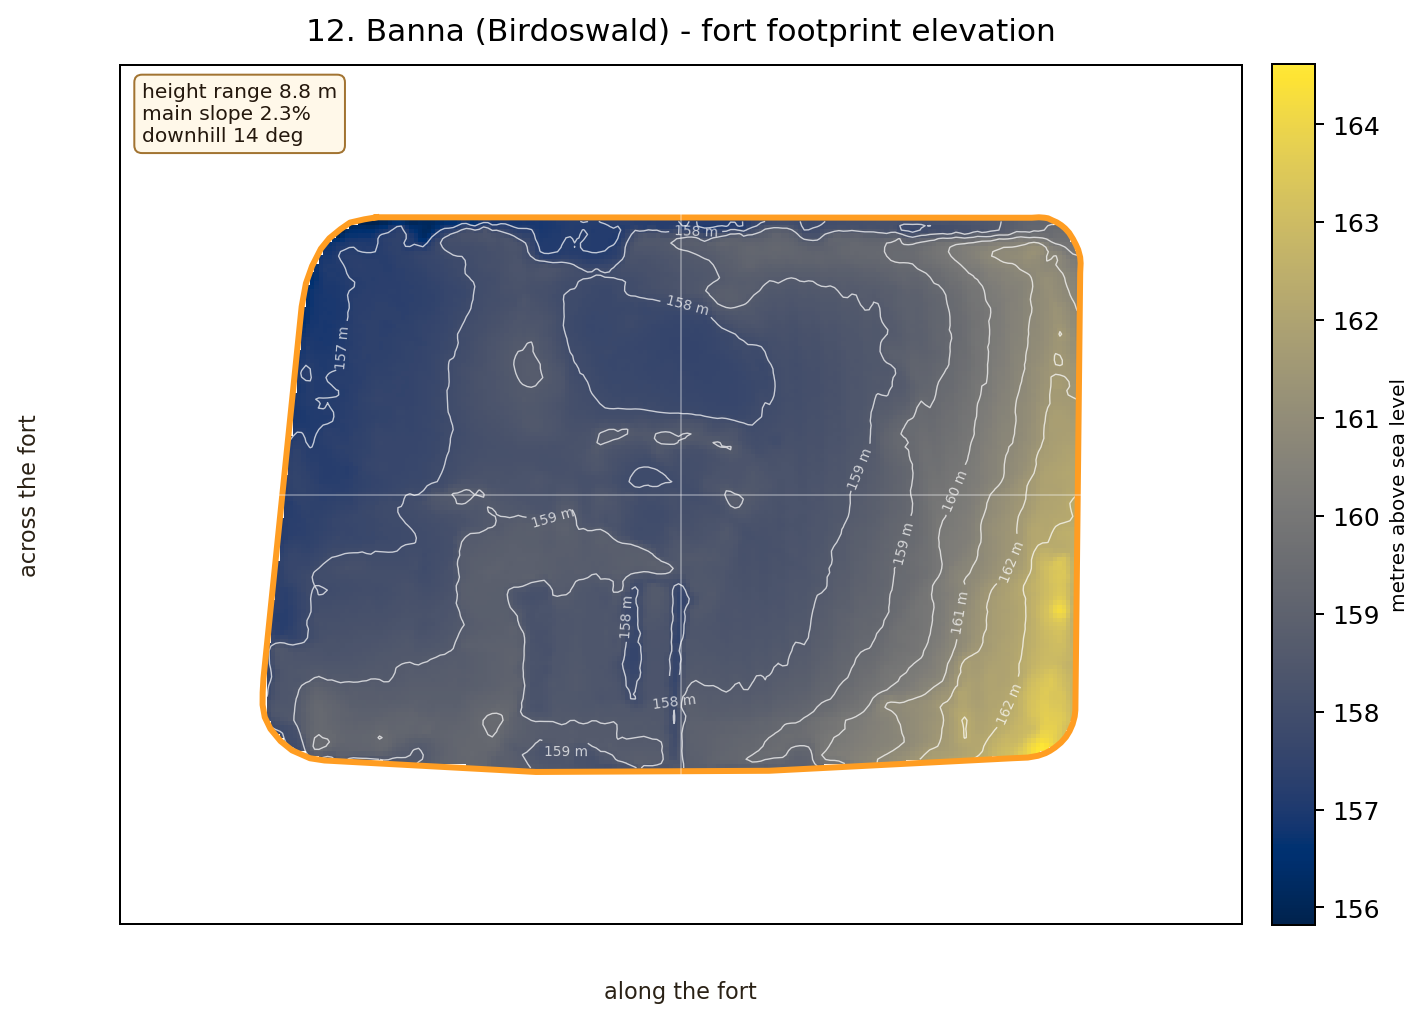
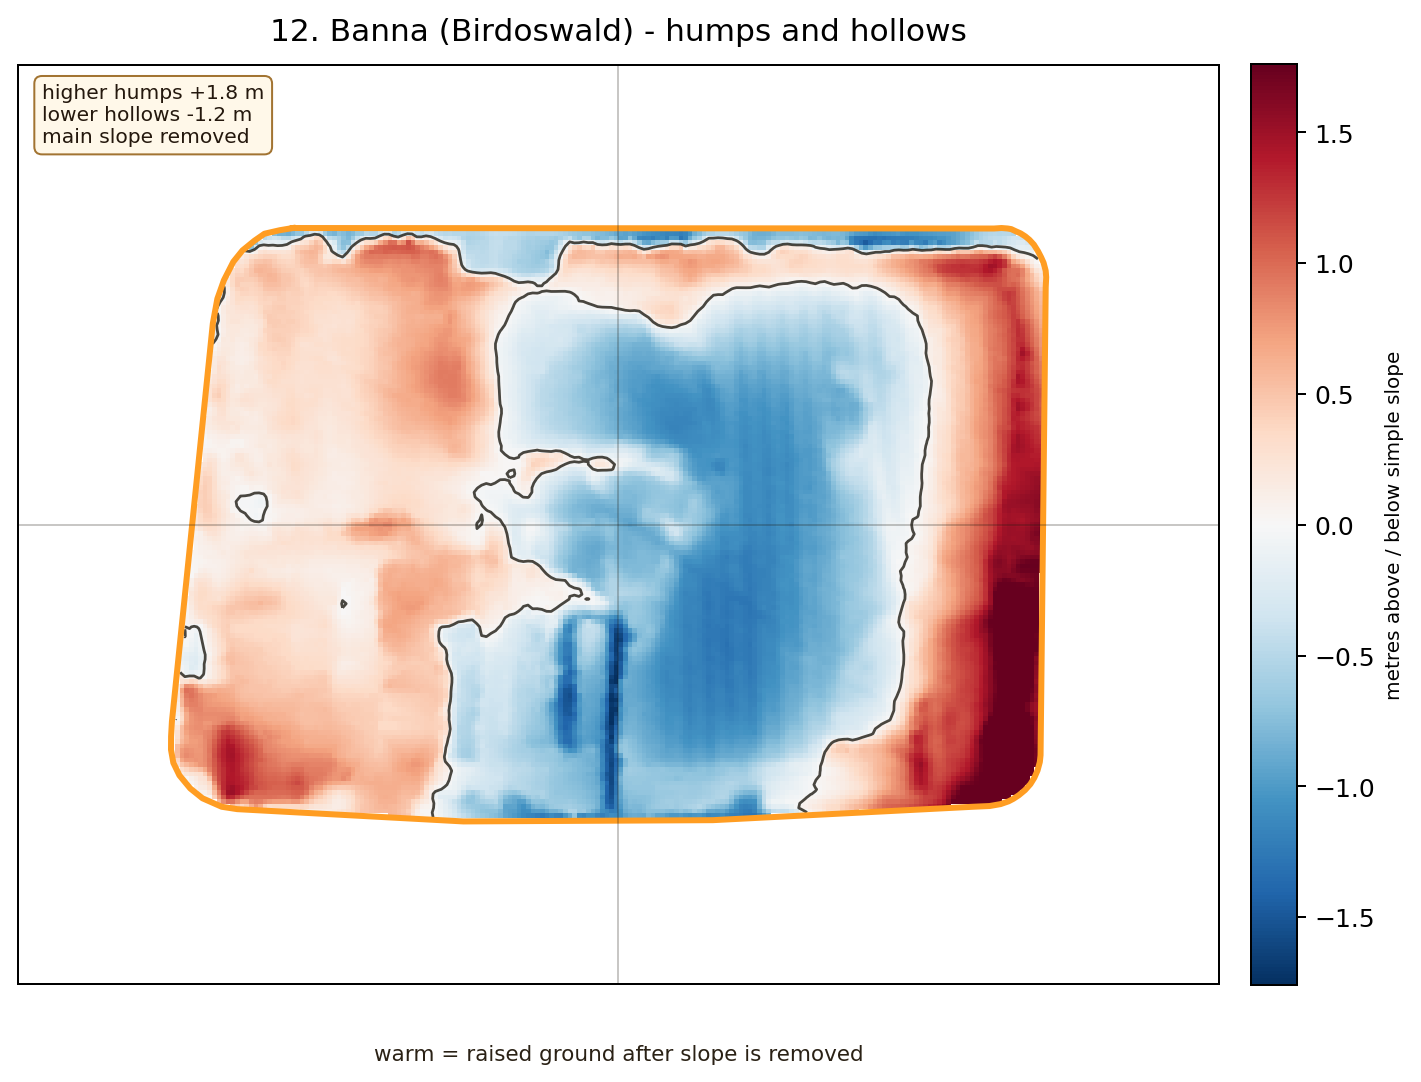
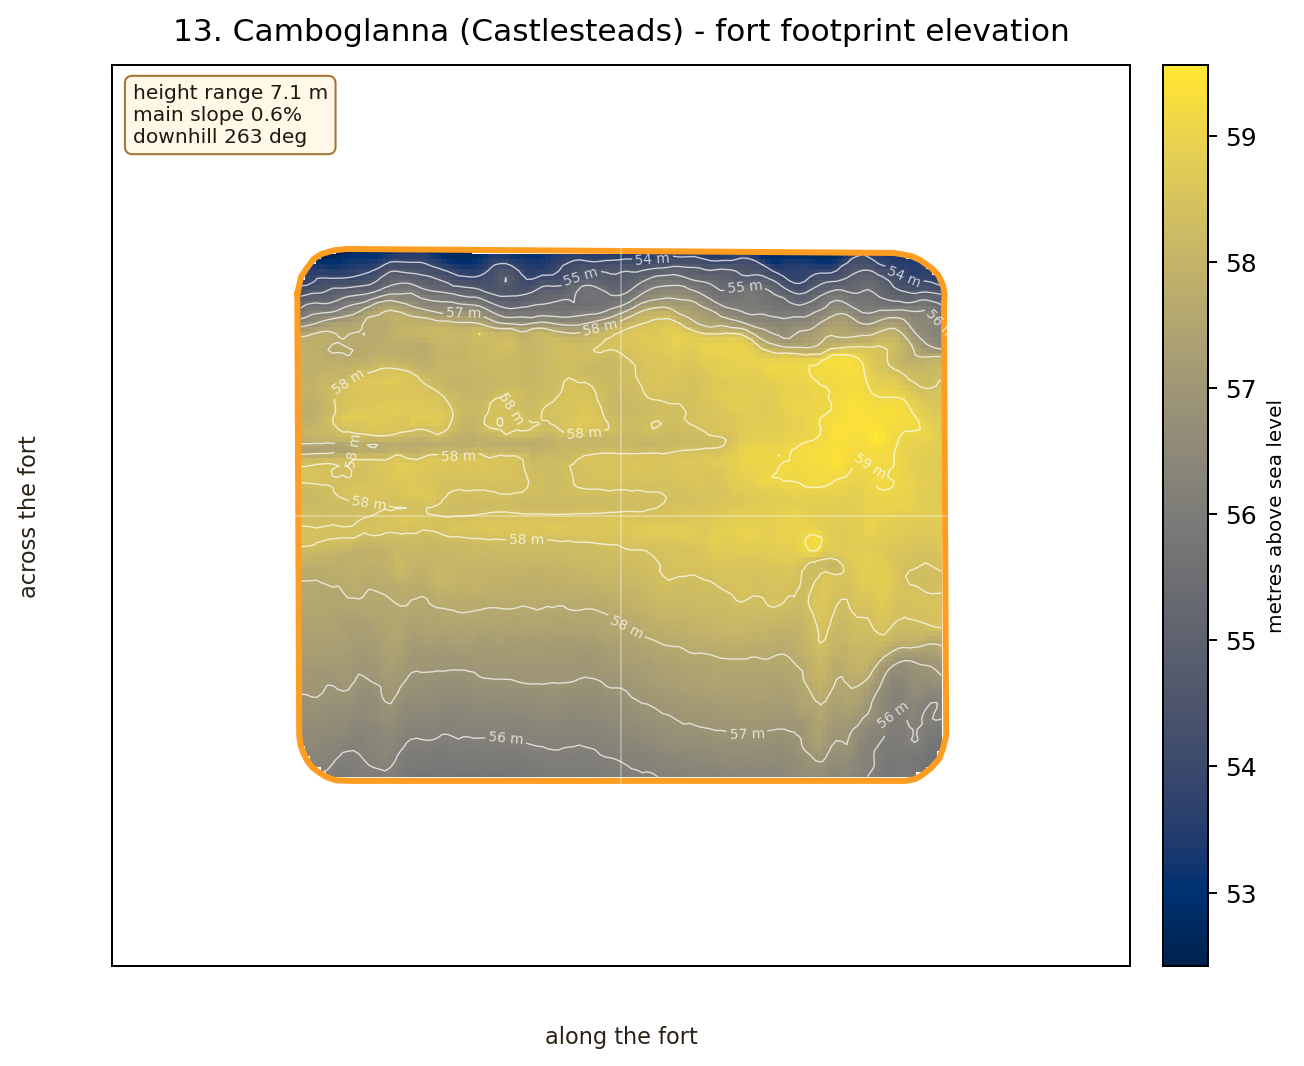
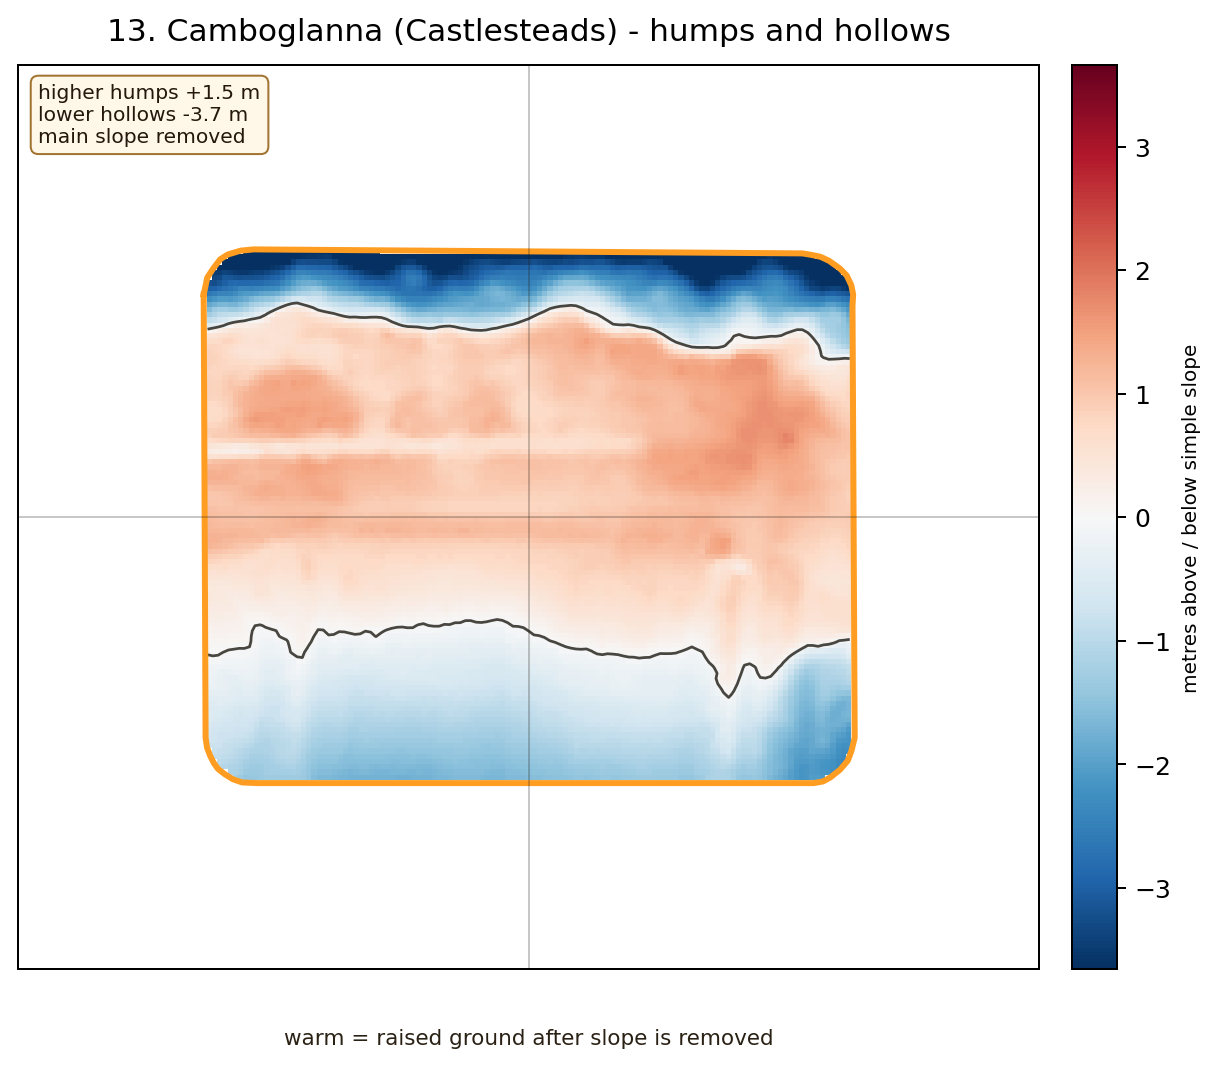
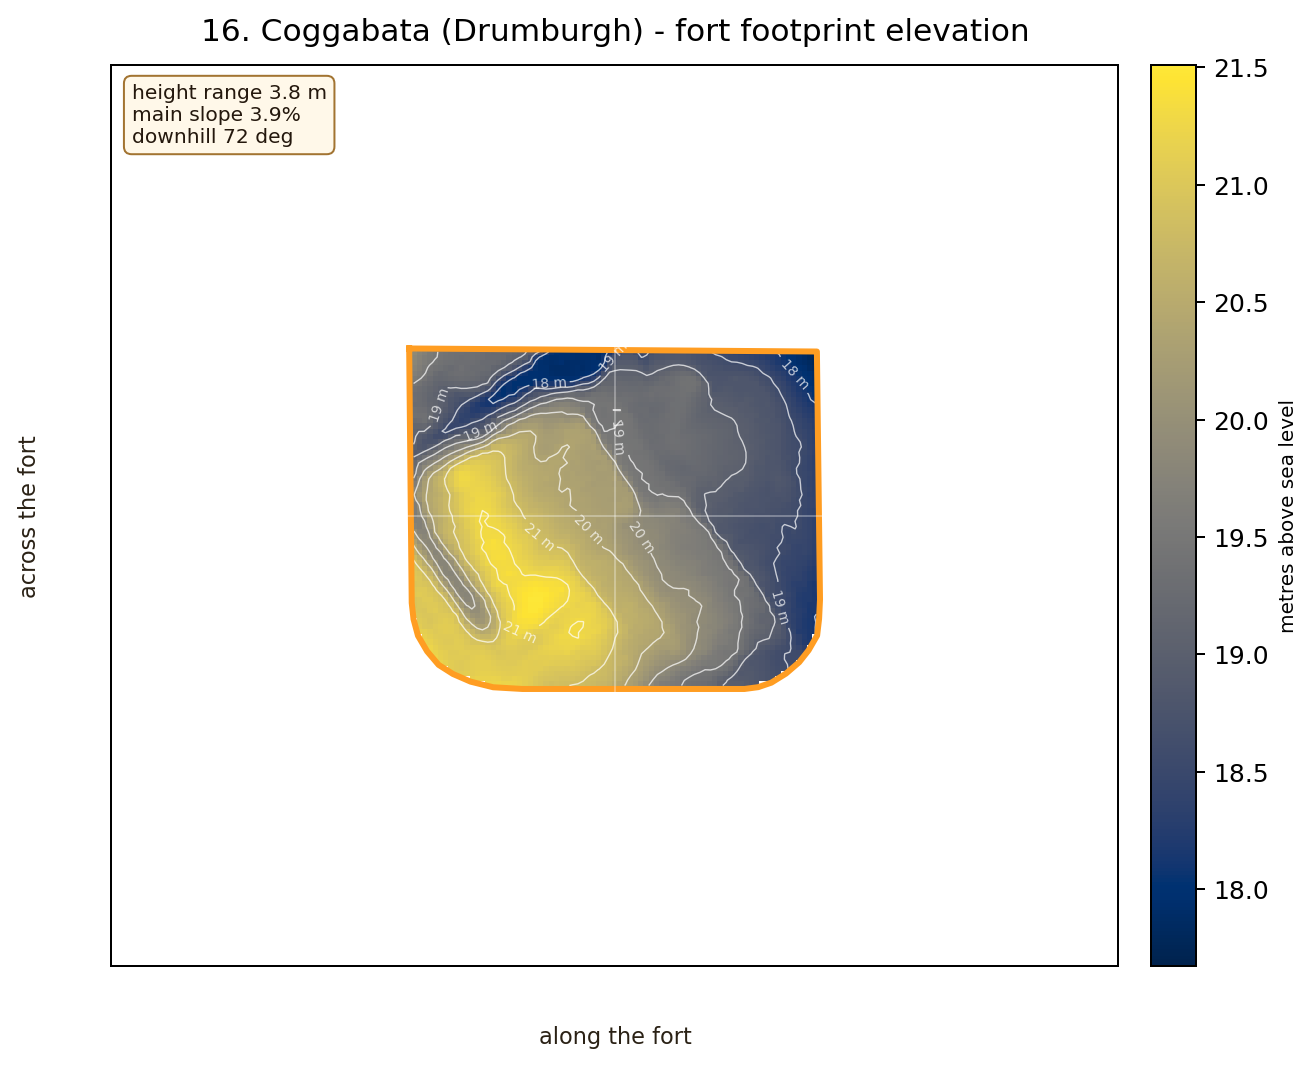
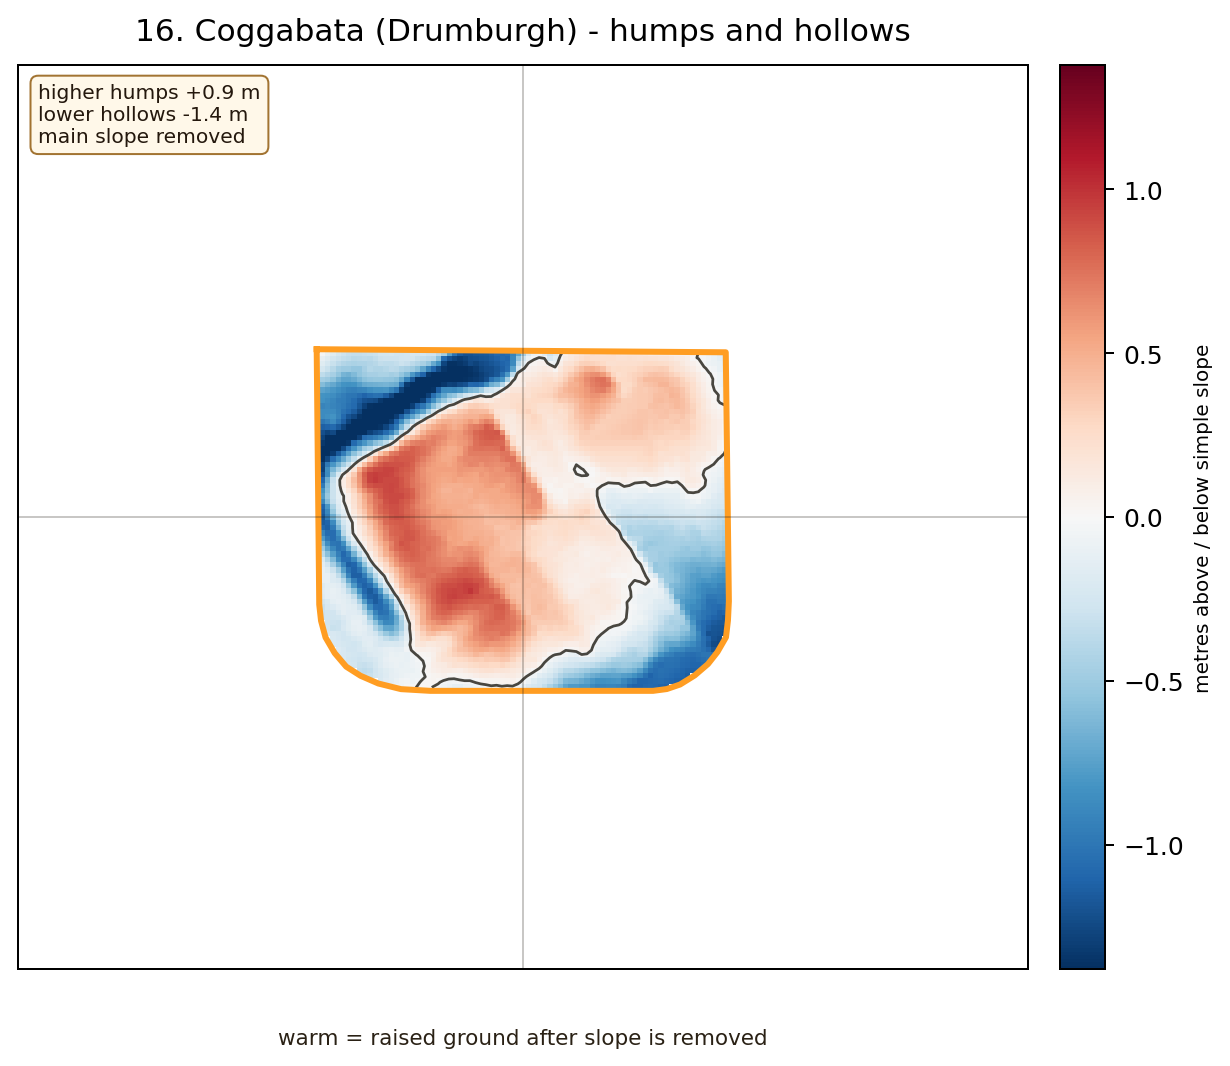
Two terrain images for each fort: real height contours, then humps and hollows after the main slope is removed. Source: EA 1 m DTM plus exact WallGIS fort polygons.
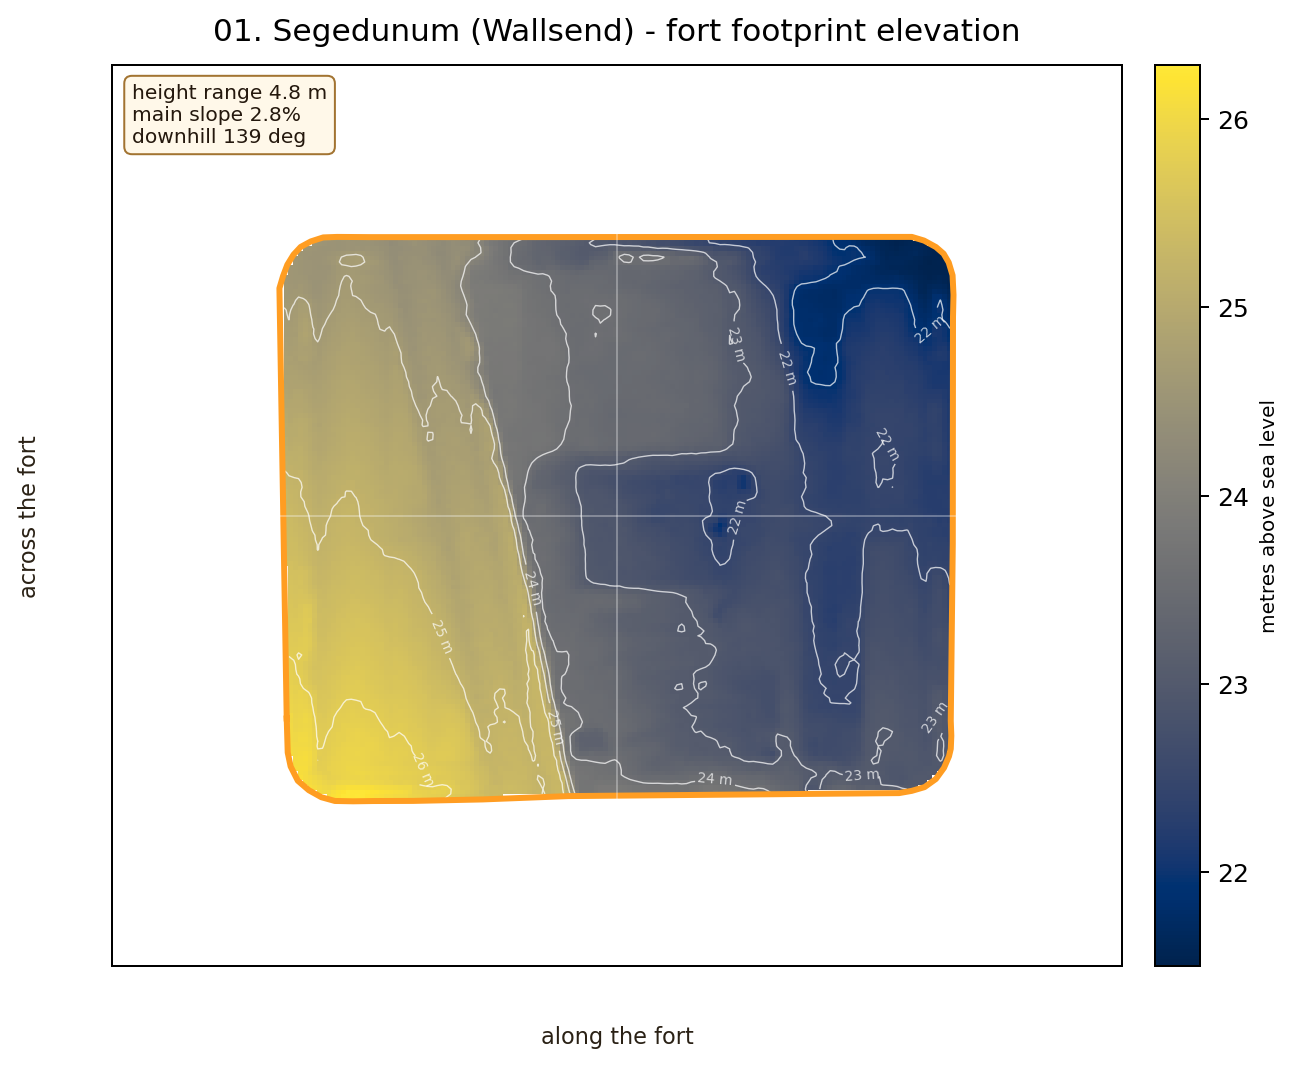
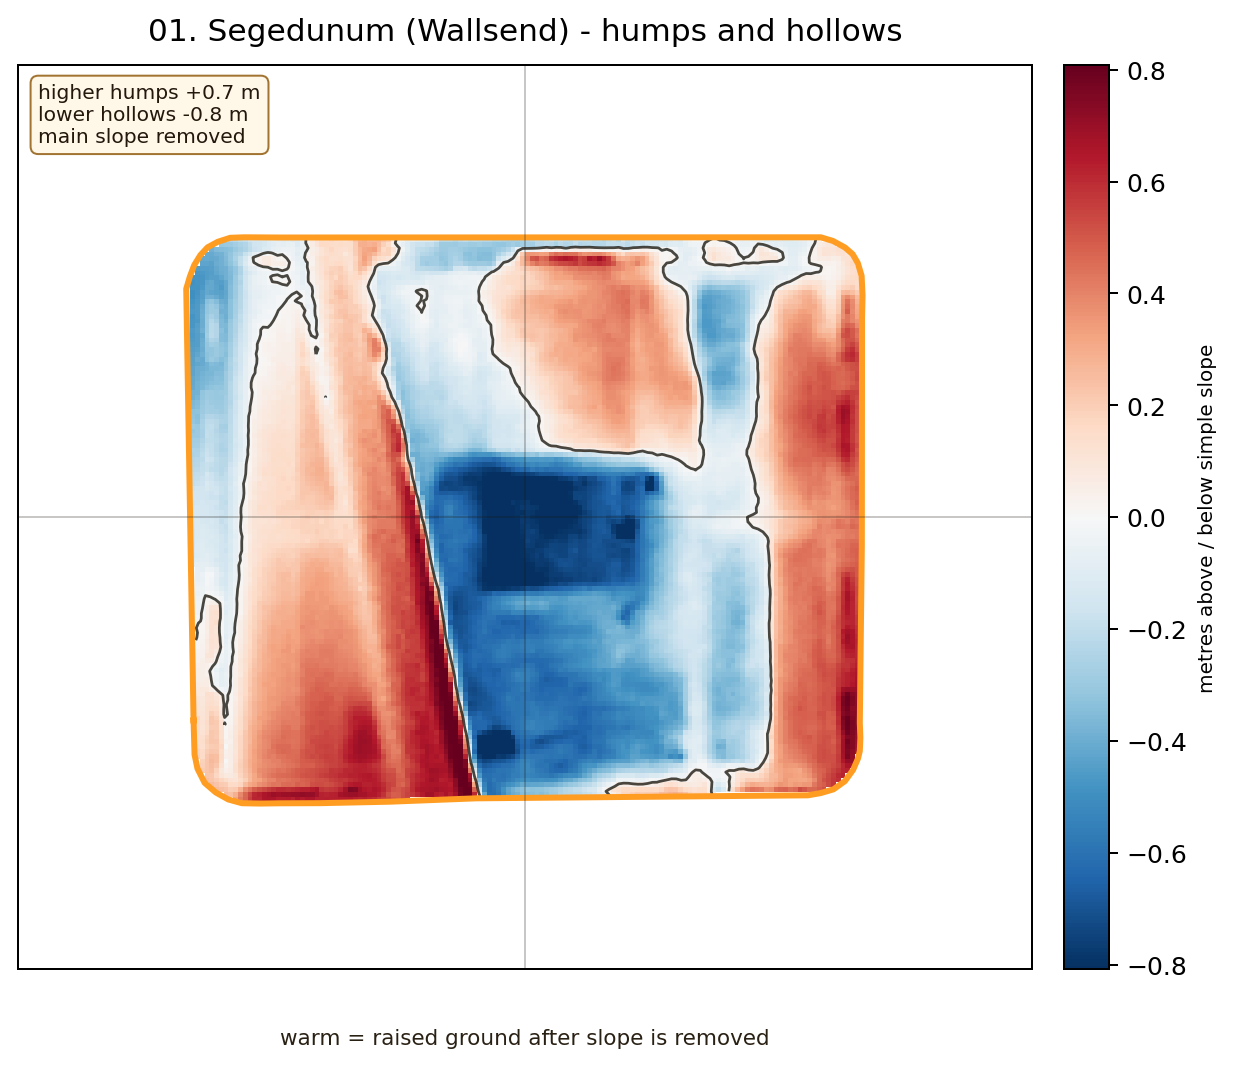
01. Segedunum Wallsend
Height range 4.785 m · slope 2.797% · long axis 157.14 deg
02. Pons Aelius Newcastle
Height range 16.441 m · slope 2.745% · long axis 179.68 deg
03. Condercum Benwell
Height range 9.159 m · slope 2.029% · long axis 22.69 deg
04. Vindobala Rudchester
Height range 4.595 m · slope 1.407% · long axis 11.81 deg
05. Onnum Halton Chesters
Height range 4.205 m · slope 0.953% · long axis 177.01 deg
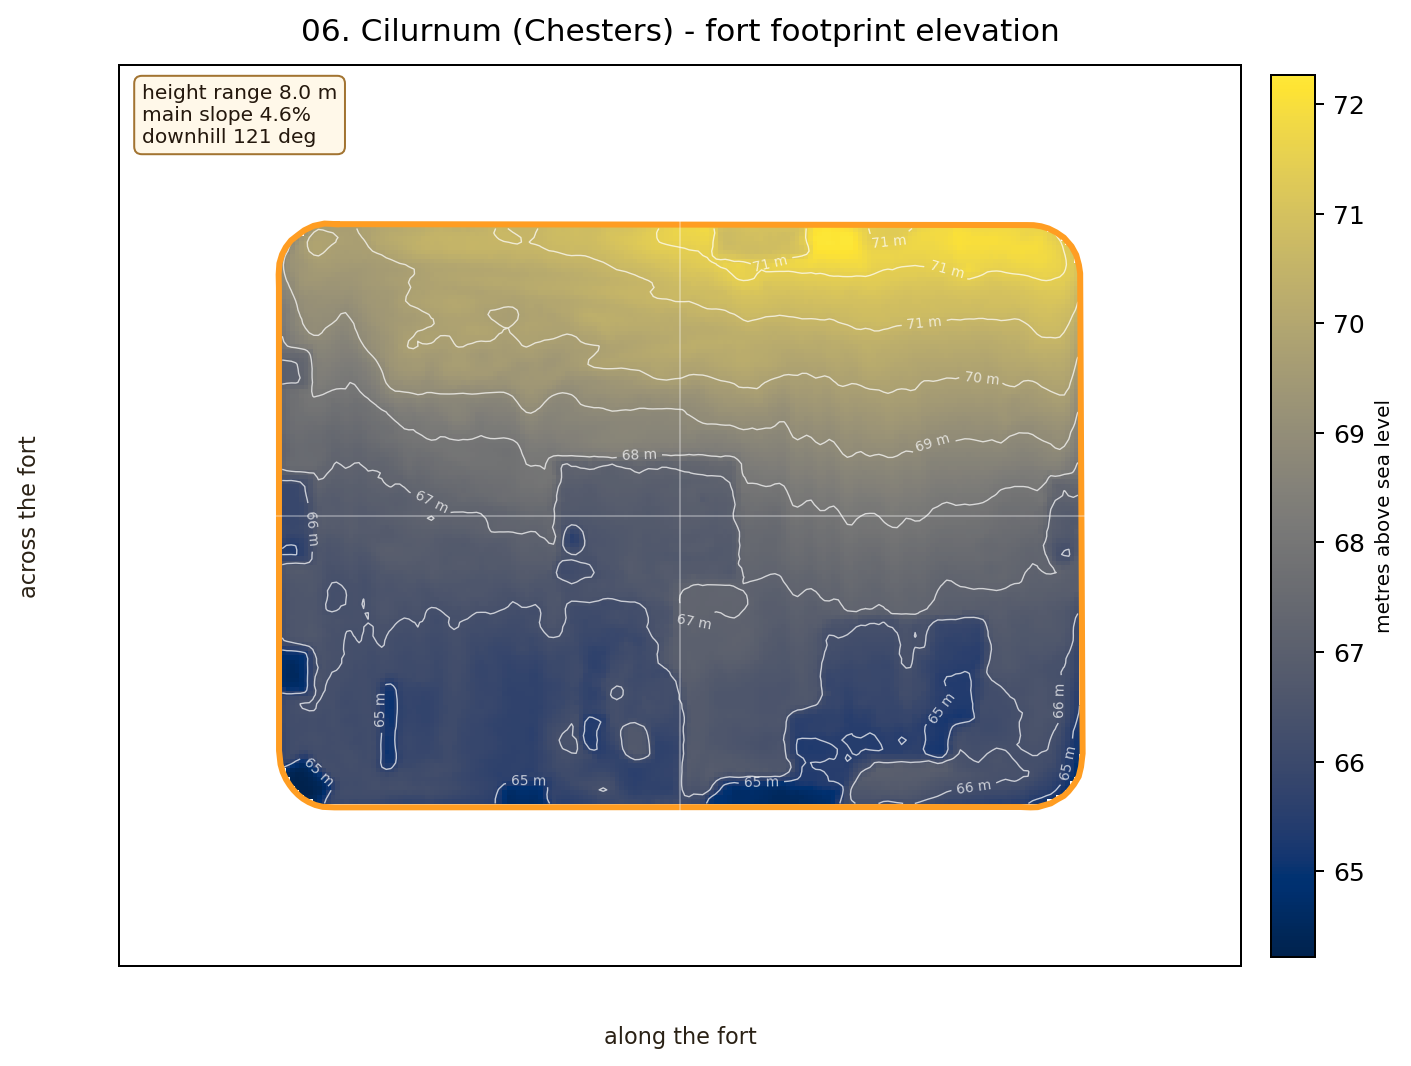
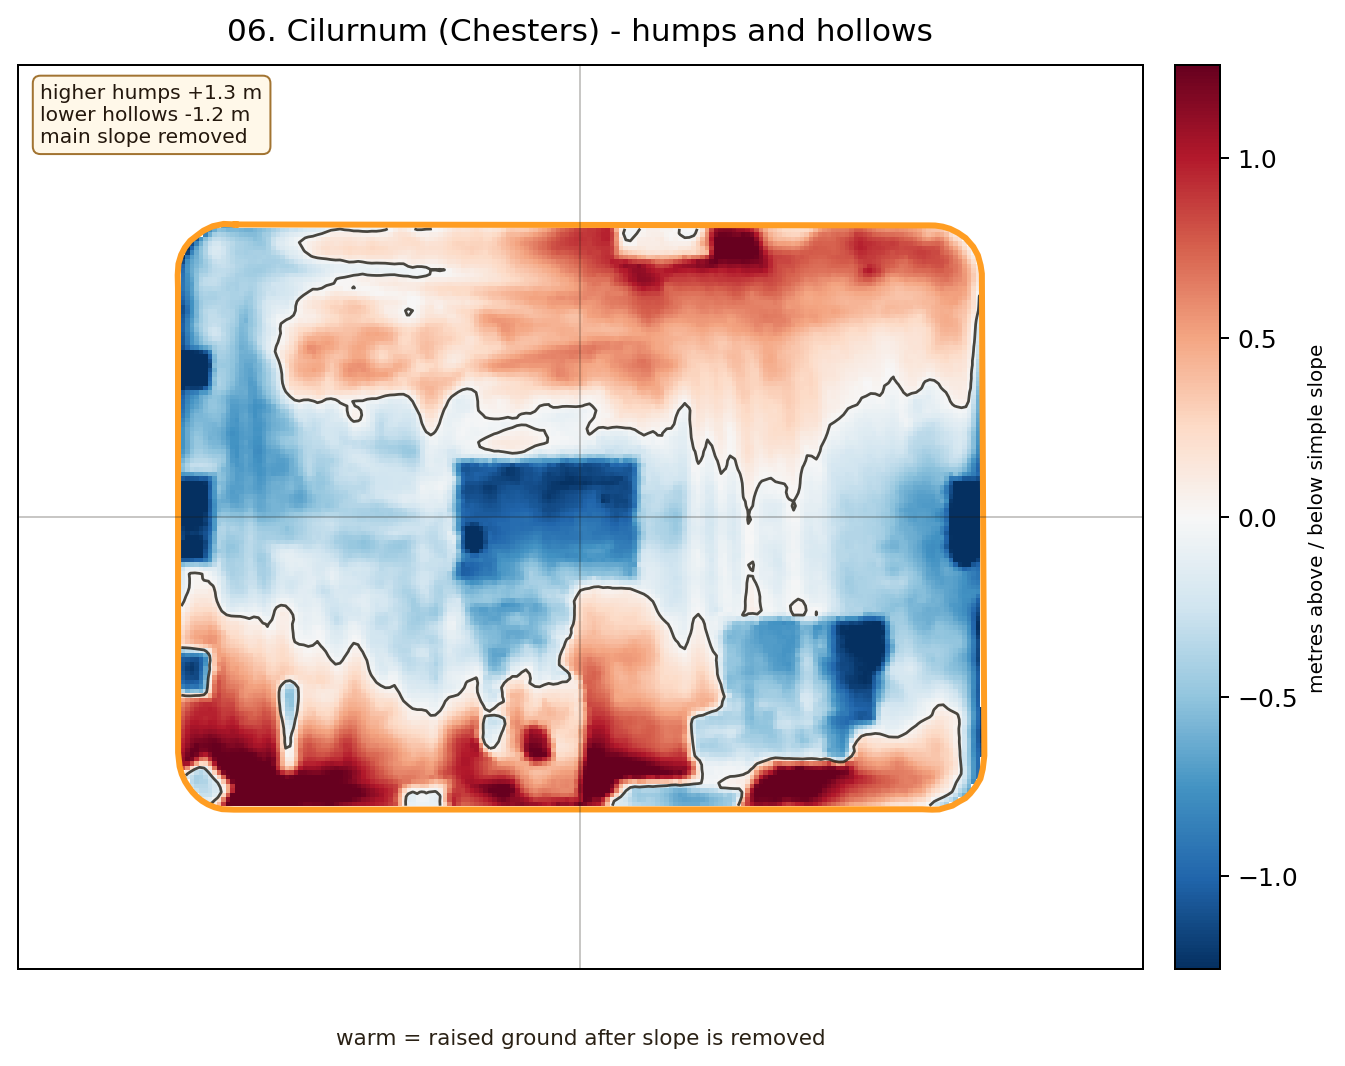
06. Cilurnum Chesters
Height range 8.048 m · slope 4.643% · long axis 22.37 deg
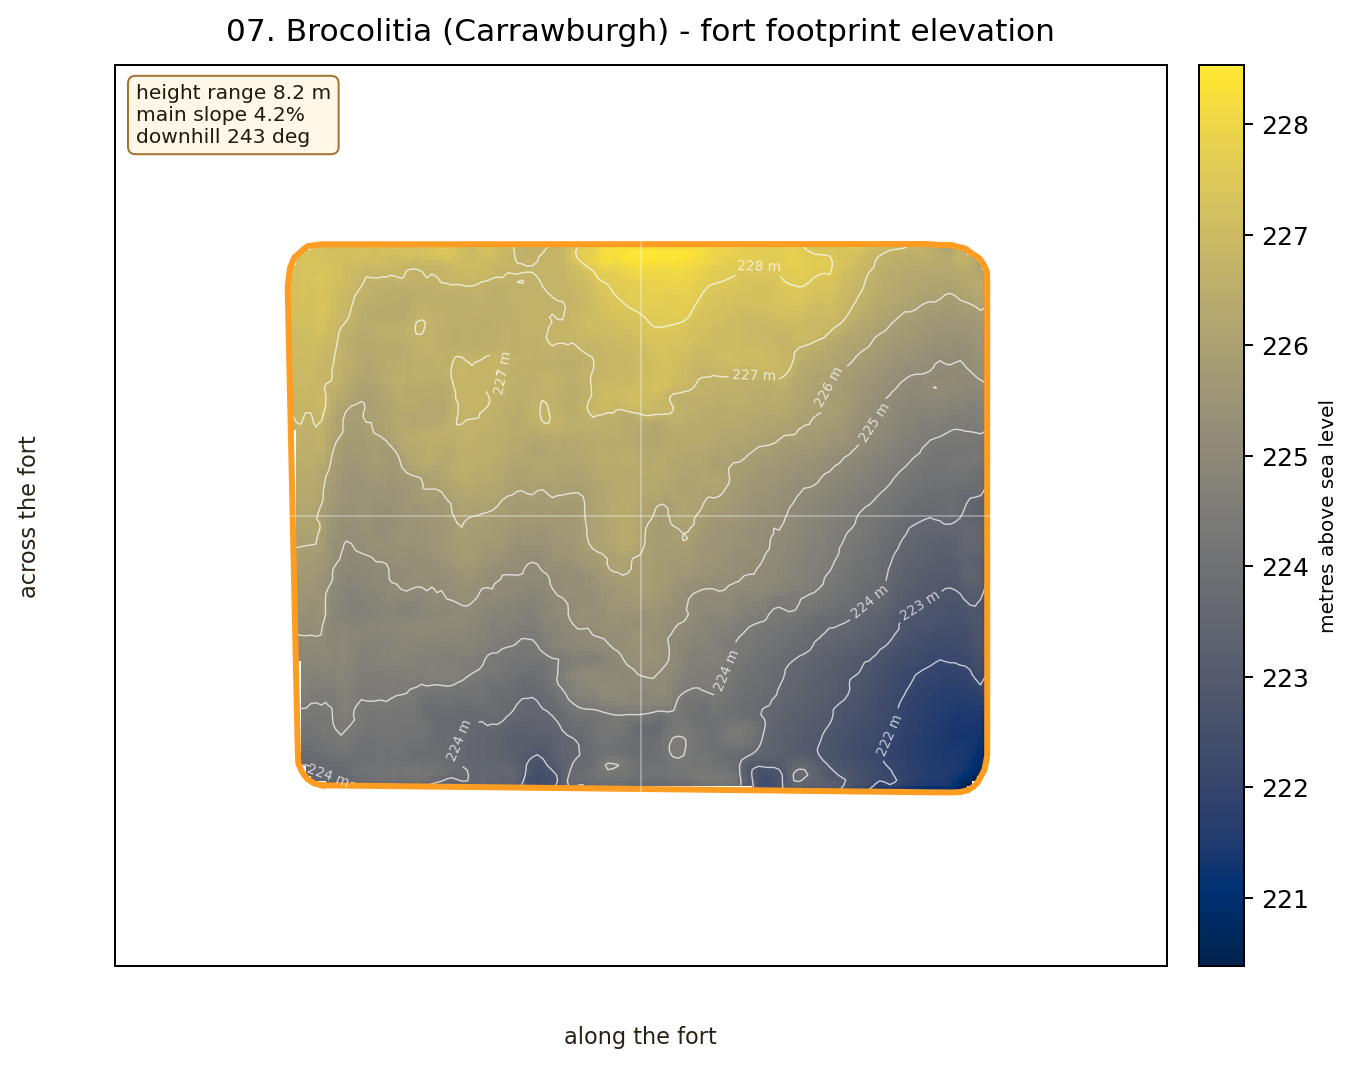
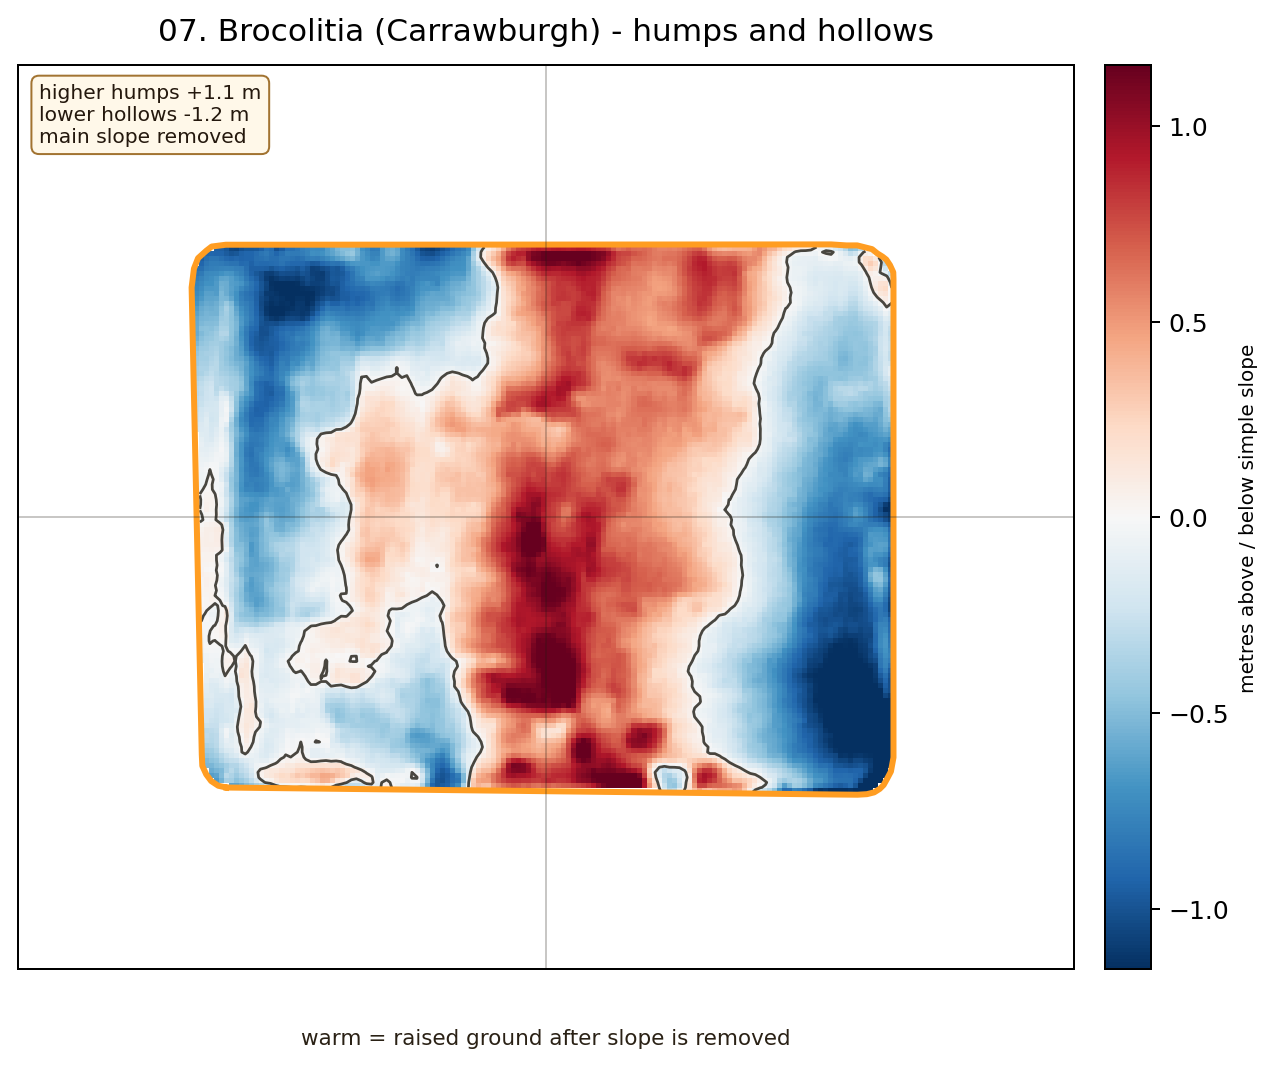
07. Brocolitia Carrawburgh
Height range 8.151 m · slope 4.191% · long axis 170.83 deg
08. Vercovicium Housesteads
Height range 22.891 m · slope 11.816% · long axis 78.02 deg
09. Vindolanda Chesterholm
Height range 6.462 m · slope 1.697% · long axis 162.5 deg
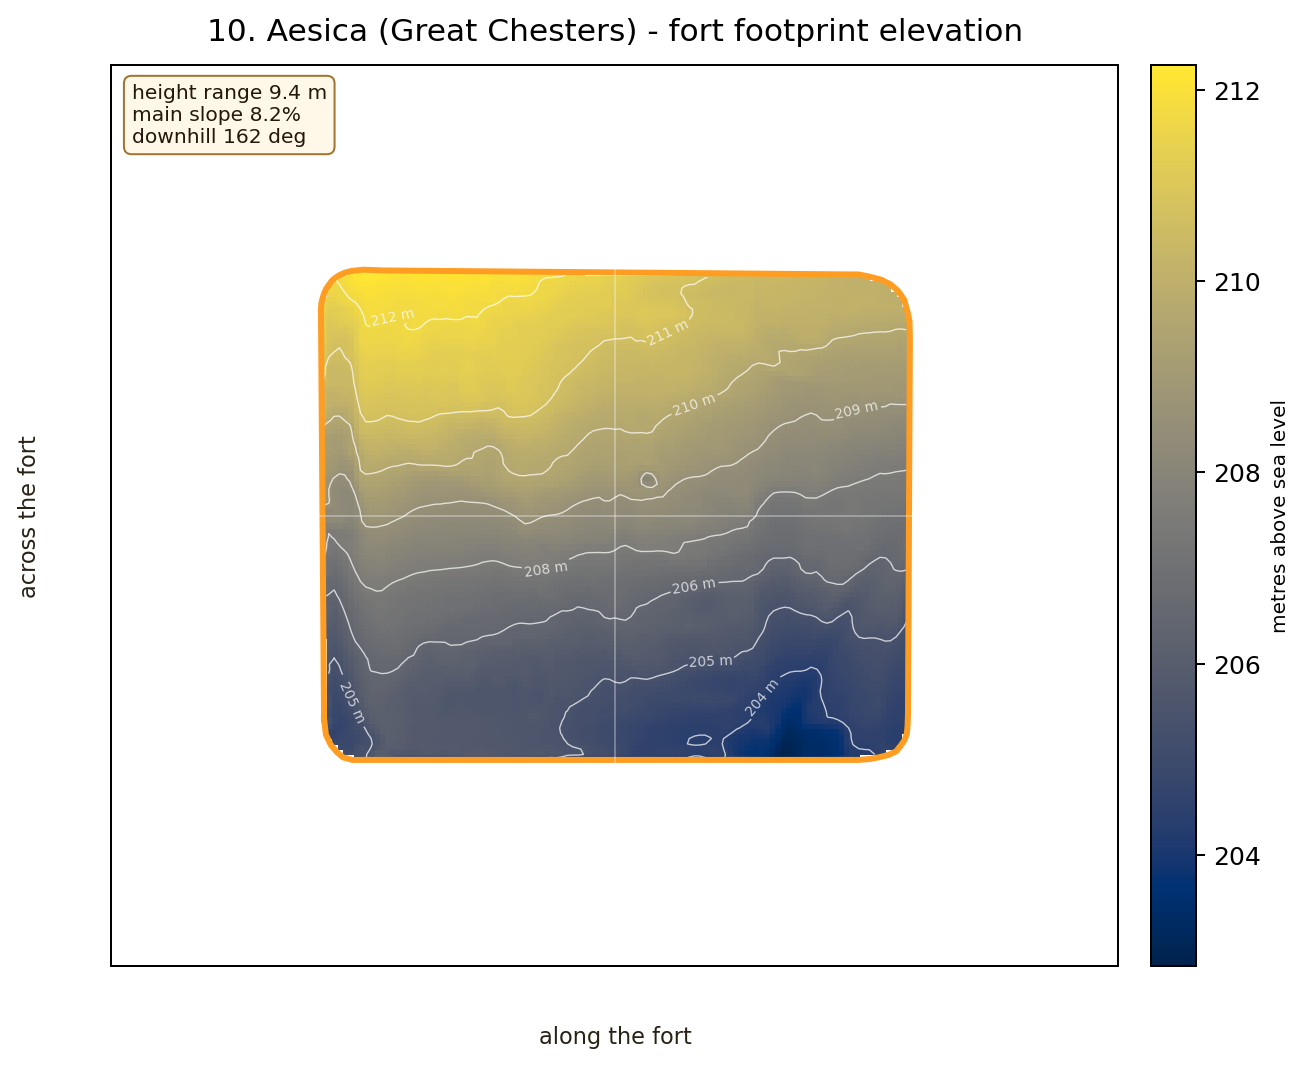
10. Aesica Great Chesters
Height range 9.421 m · slope 8.175% · long axis 84.3 deg
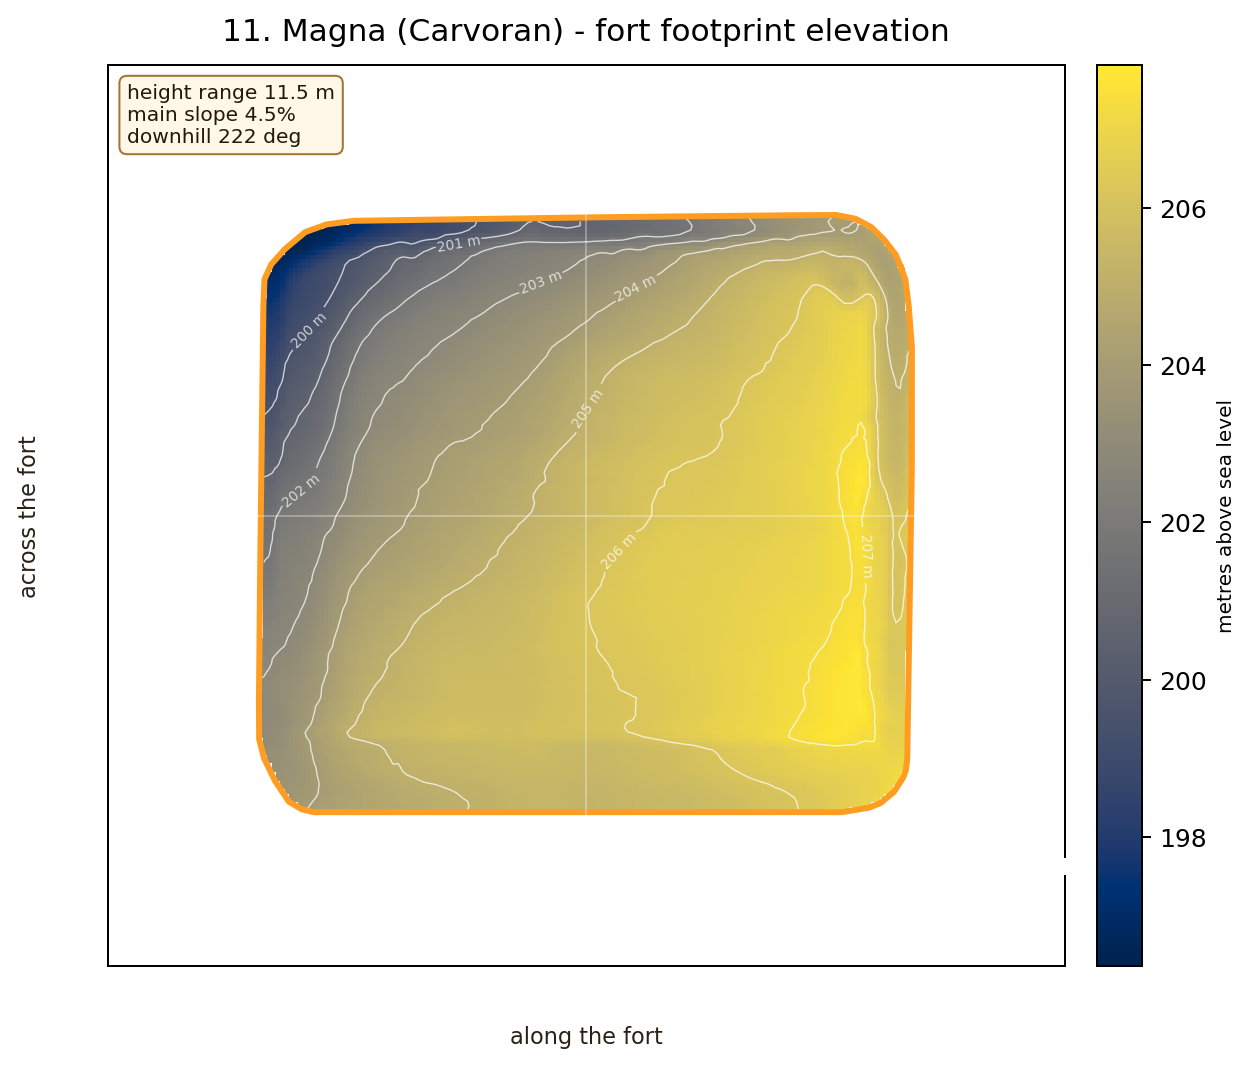
11. Magna Carvoran
Height range 11.455 m · slope 4.502% · long axis 4.04 deg
12. Banna Birdoswald
Height range 8.79 m · slope 2.32% · long axis 161.21 deg
13. Camboglanna Castlesteads
Height range 7.147 m · slope 0.616% · long axis 54.52 deg
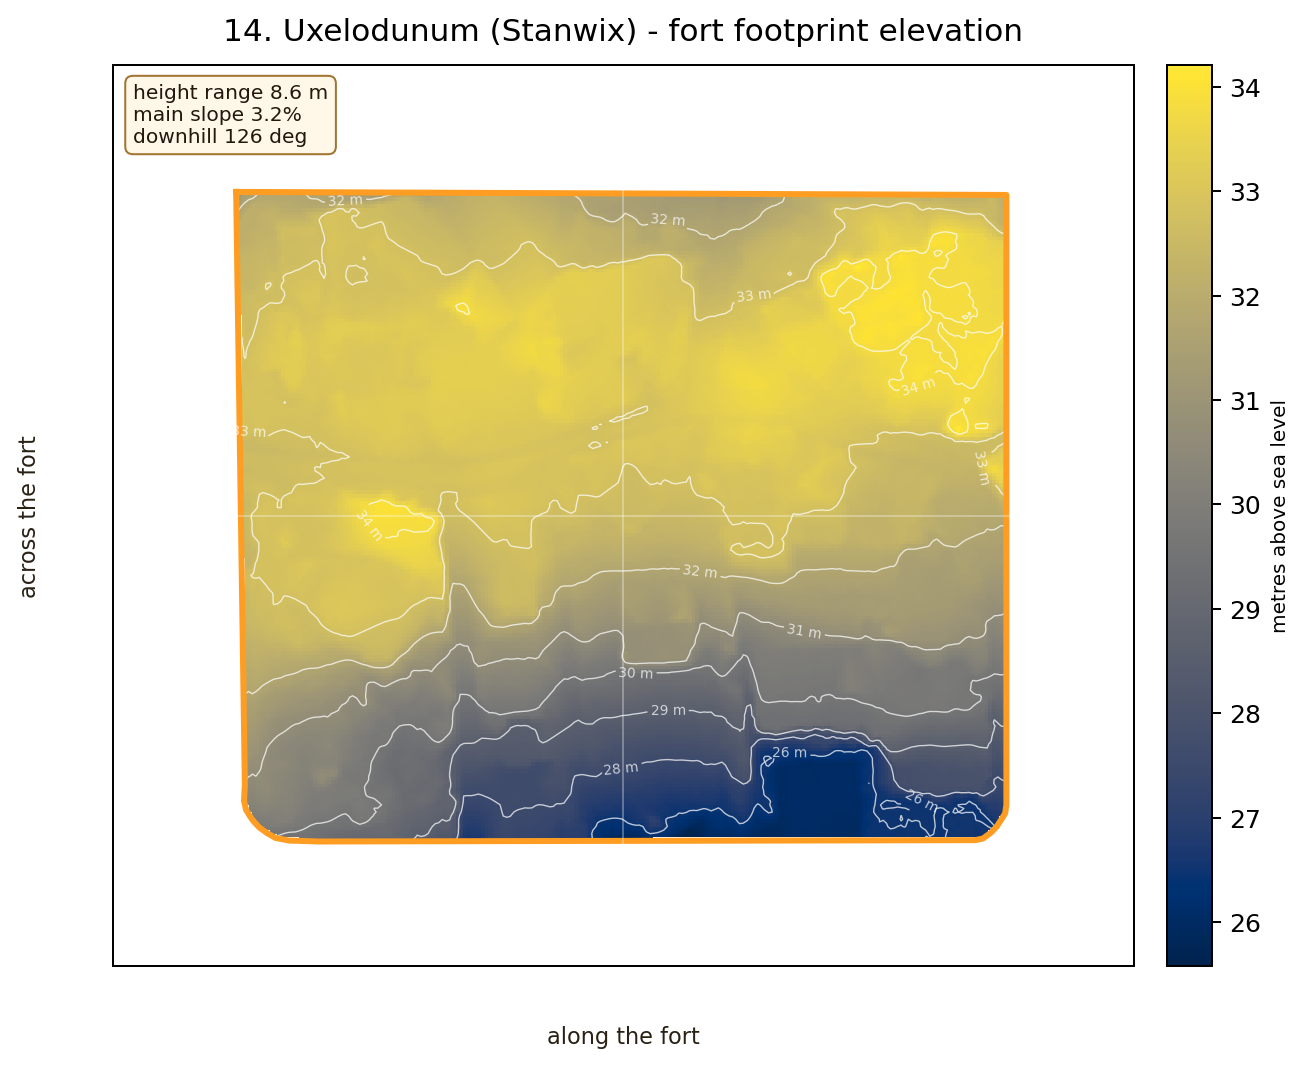
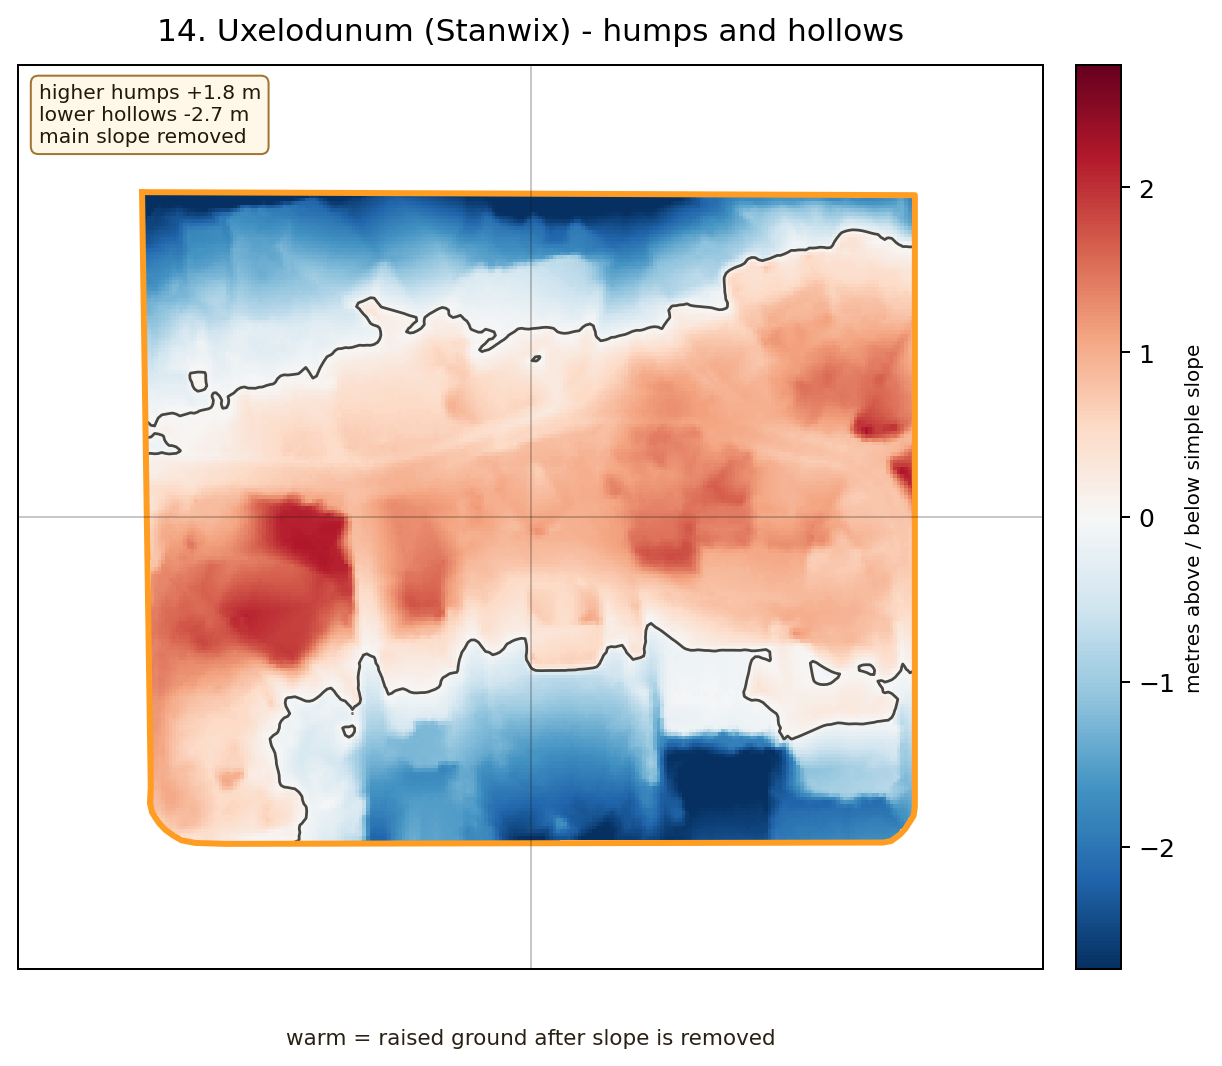
14. Uxelodunum Stanwix
Height range 8.629 m · slope 3.239% · long axis 43.81 deg
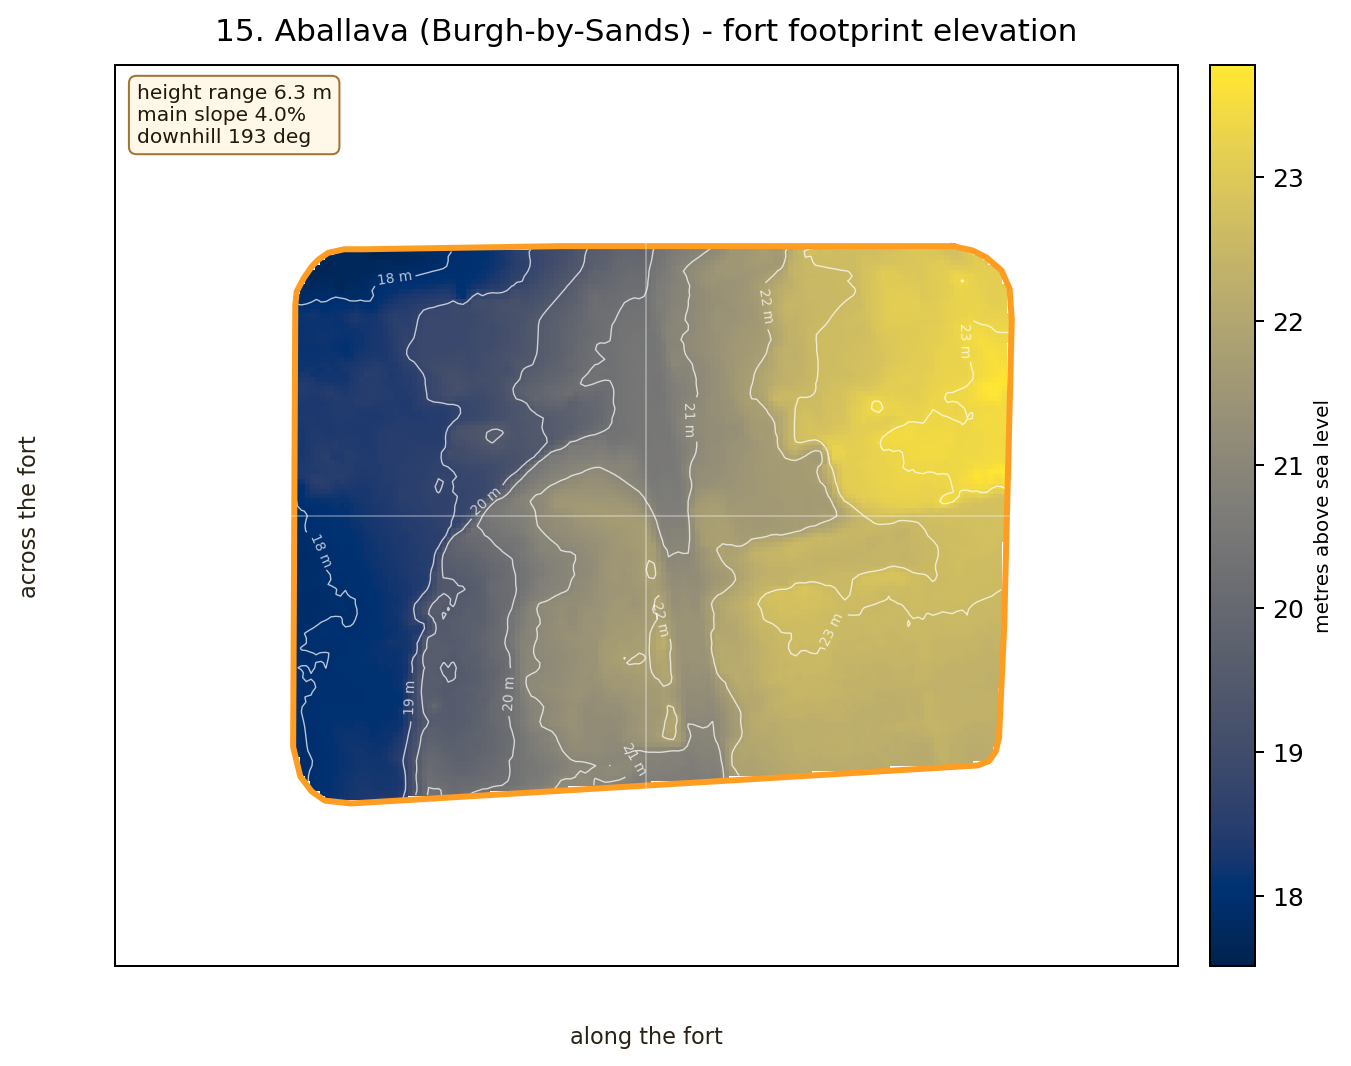
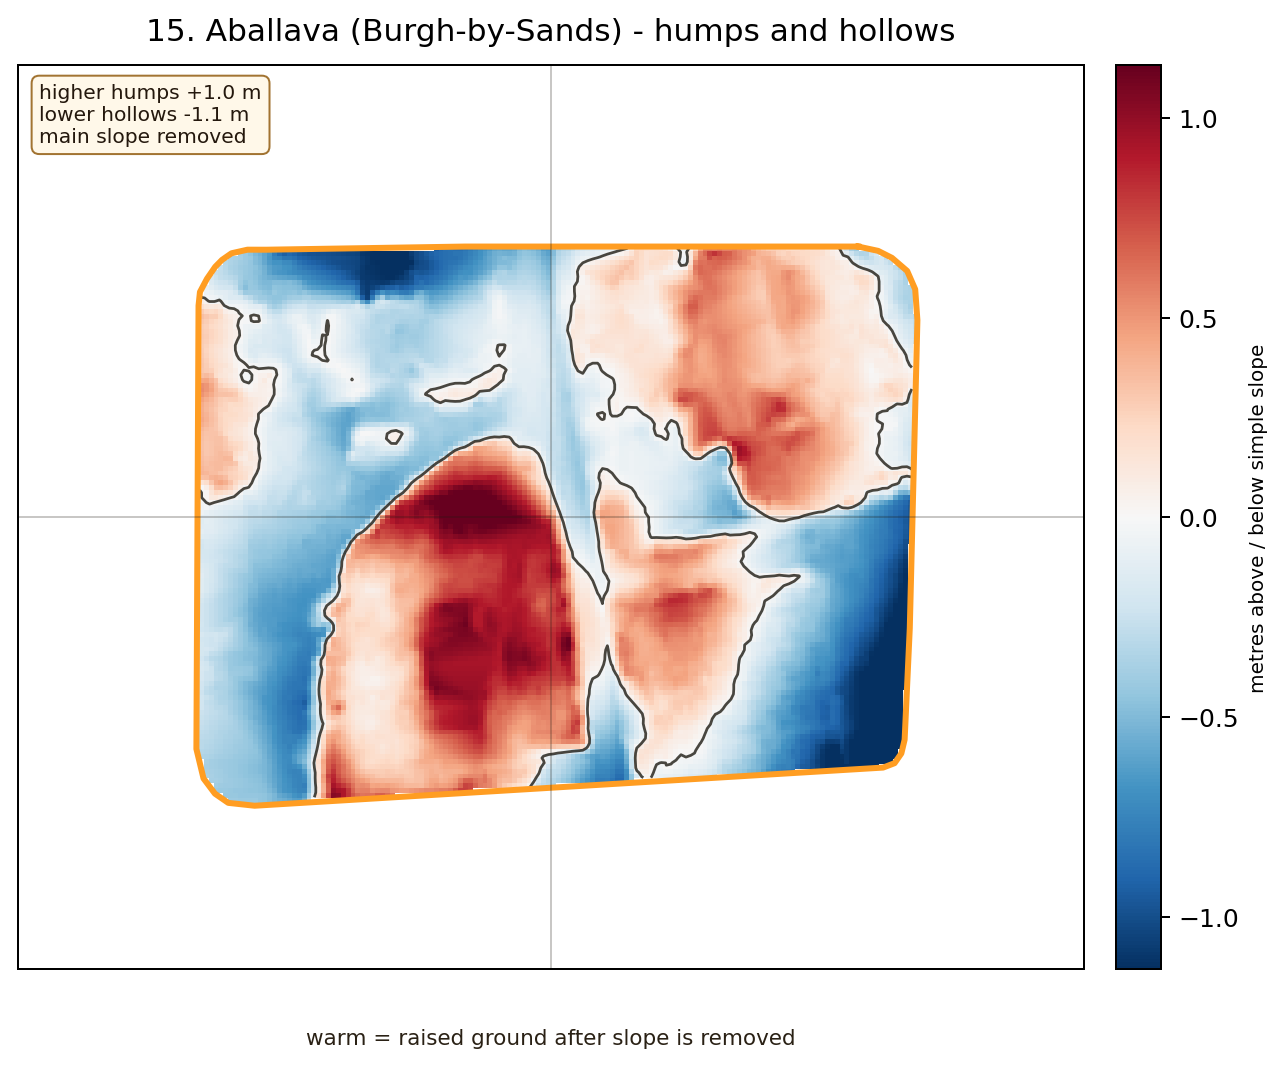
15. Aballava Burgh-by-Sands
Height range 6.264 m · slope 3.985% · long axis 6.8 deg
16. Coggabata Drumburgh
Height range 3.836 m · slope 3.907% · long axis 117.92 deg
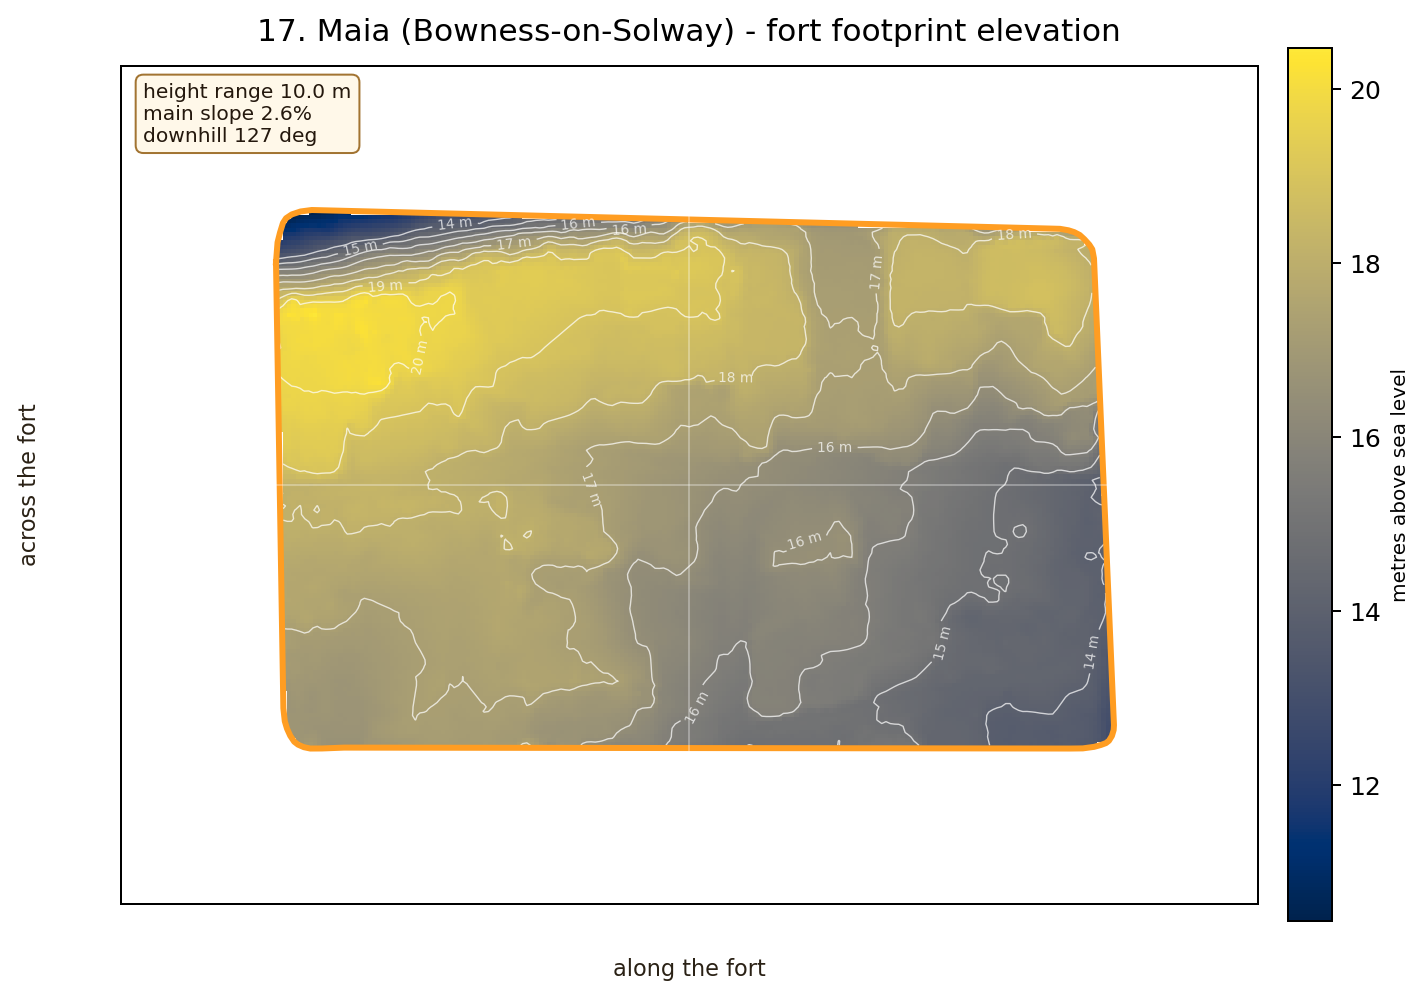
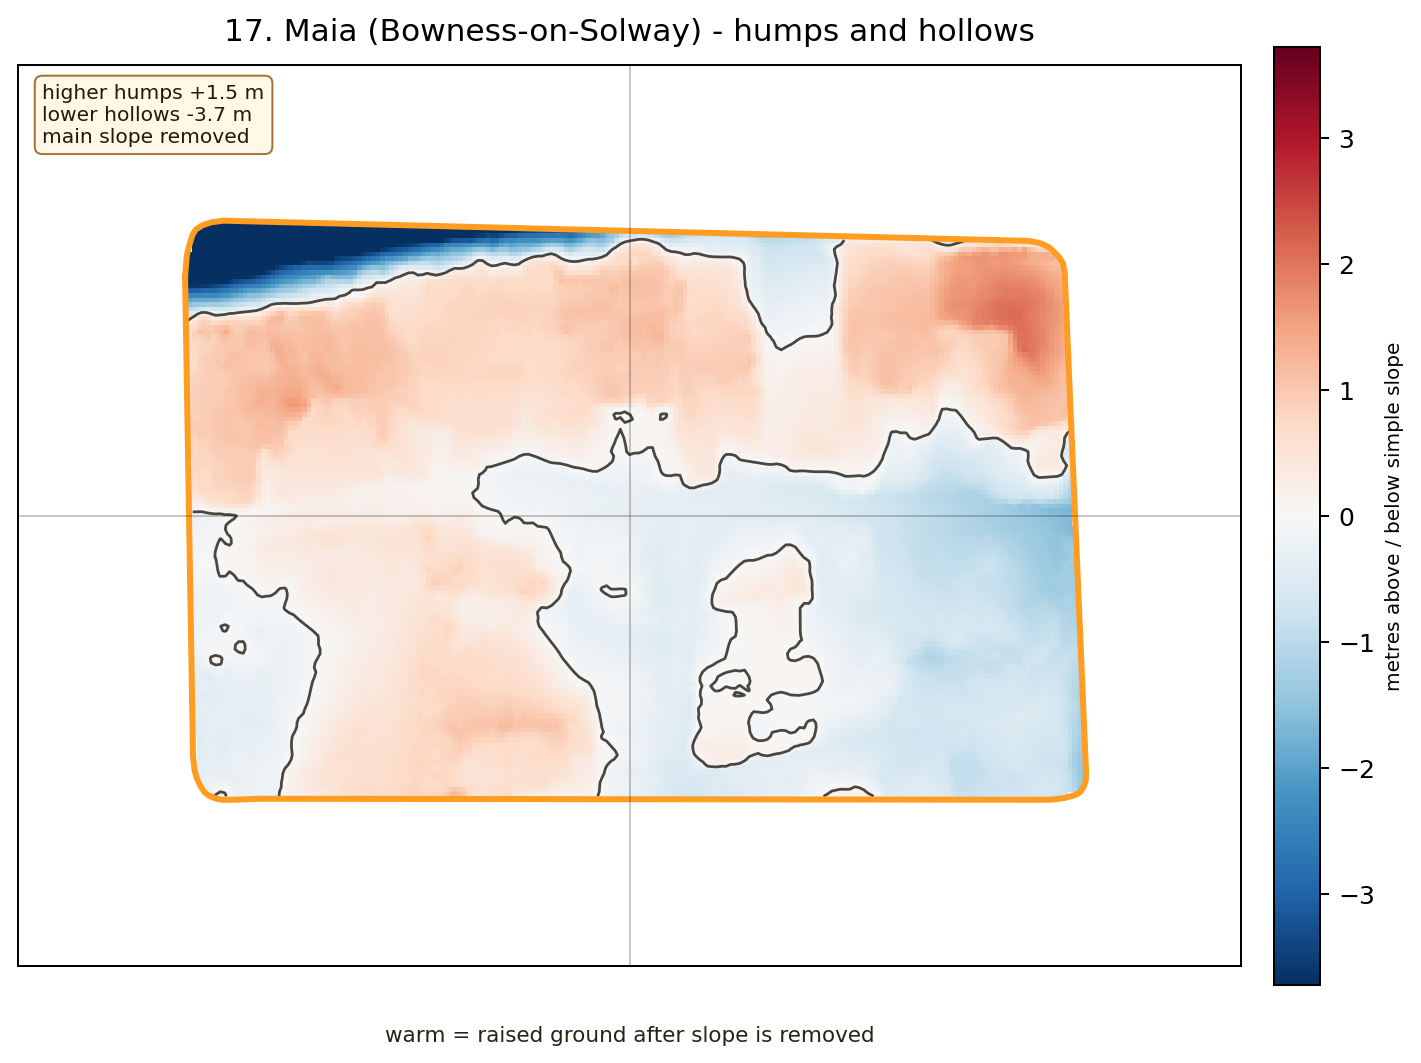
17. Maia Bowness-on-Solway
Height range 10.026 m · slope 2.612% · long axis 70.2 deg